Some people worry about rising sea levels due to global warming. But that will happen slowly. I worry about tipping points.
The word “tipping point” should remind you of pushing on a glass of water. If you push it a little, and then stop, it’ll right itself: no harm done. But if you push it past a certain point, it starts tipping over. Then it’s hard to stop.
So, we need to study possible tipping points in the Earth’s climate system. Here’s a list of them:
• Tipping point, Azimuth Library.
Today I want to talk about one: melting permafrost. When melting permafrost in the Arctic starts releasing lots of carbon dioxide and methane—a vastly more potent greenhouse gas—the Earth will get even hotter. That, in turn, will melt even more permafrost. In theory, this feedback loop could tip the Earth over to a much hotter state. But how much should we worry about this?
Climate activist Joe Romm takes it very seriously:
• Joe Romm, NSIDC bombshell: Thawing permafrost feedback will turn Arctic from carbon sink to source in the 2020s, releasing 100 billion tons of carbon by 2100, Climate Progress, 17 February 2011.
If you click on just one link of mine today, let it be this! He writes in a clear, snappy way. But let me take you through some of the details in my own more pedestrian fashion.
For starters, the Arctic is melting. Here’s a graph of Arctic sea ice volume created by the Pan-Arctic Ice Ocean Modeling and Assimilation System—click to enlarge:
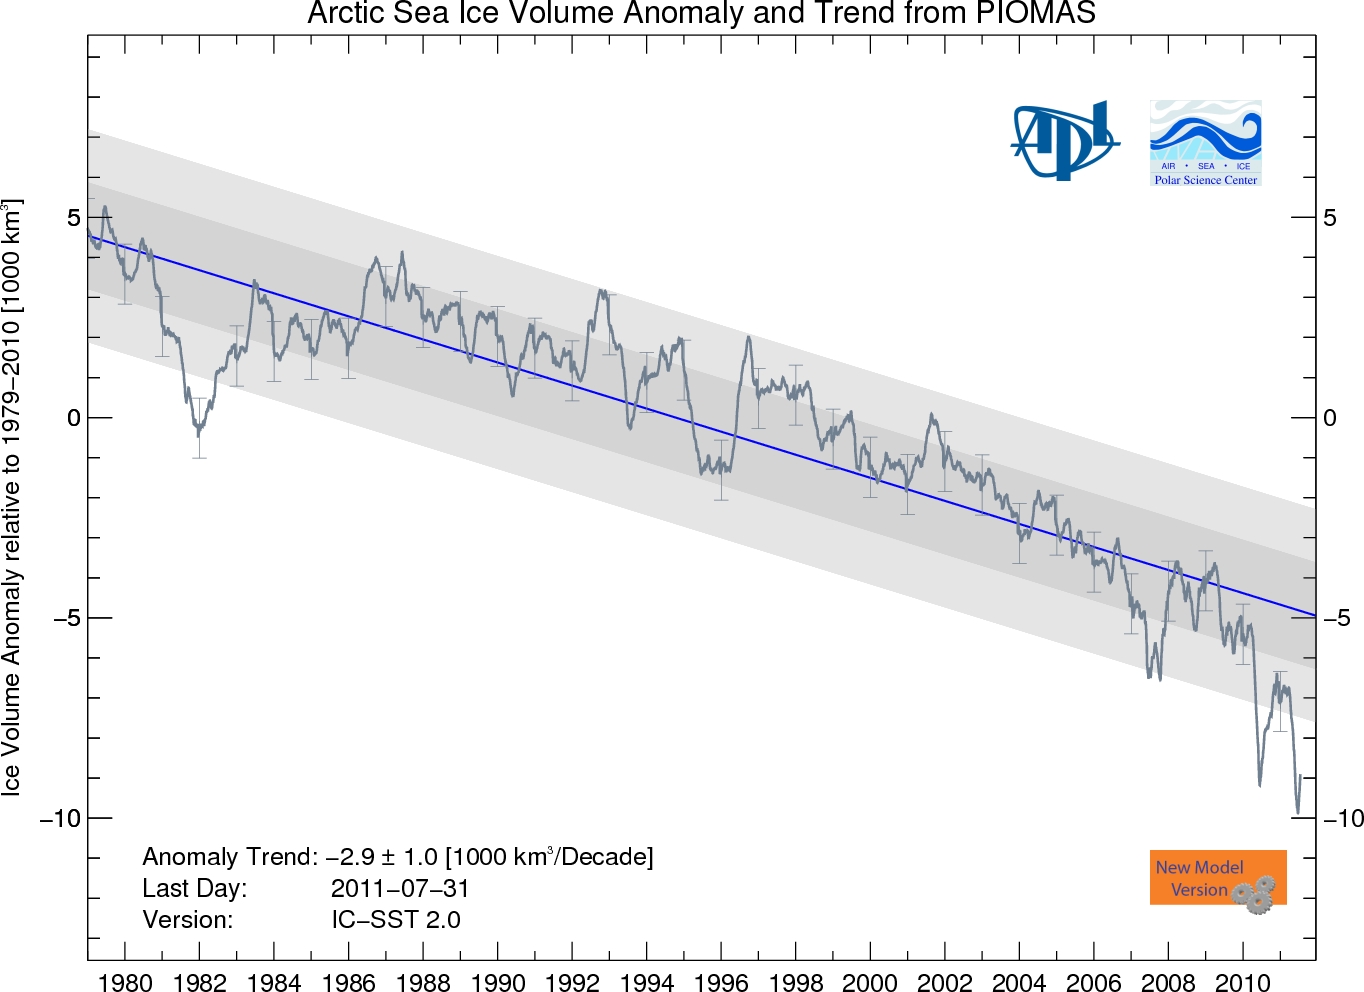
The blue line is the linear best fit, but you can see it’s been melting faster lately. Is this a glitch or a new trend? Time will tell.
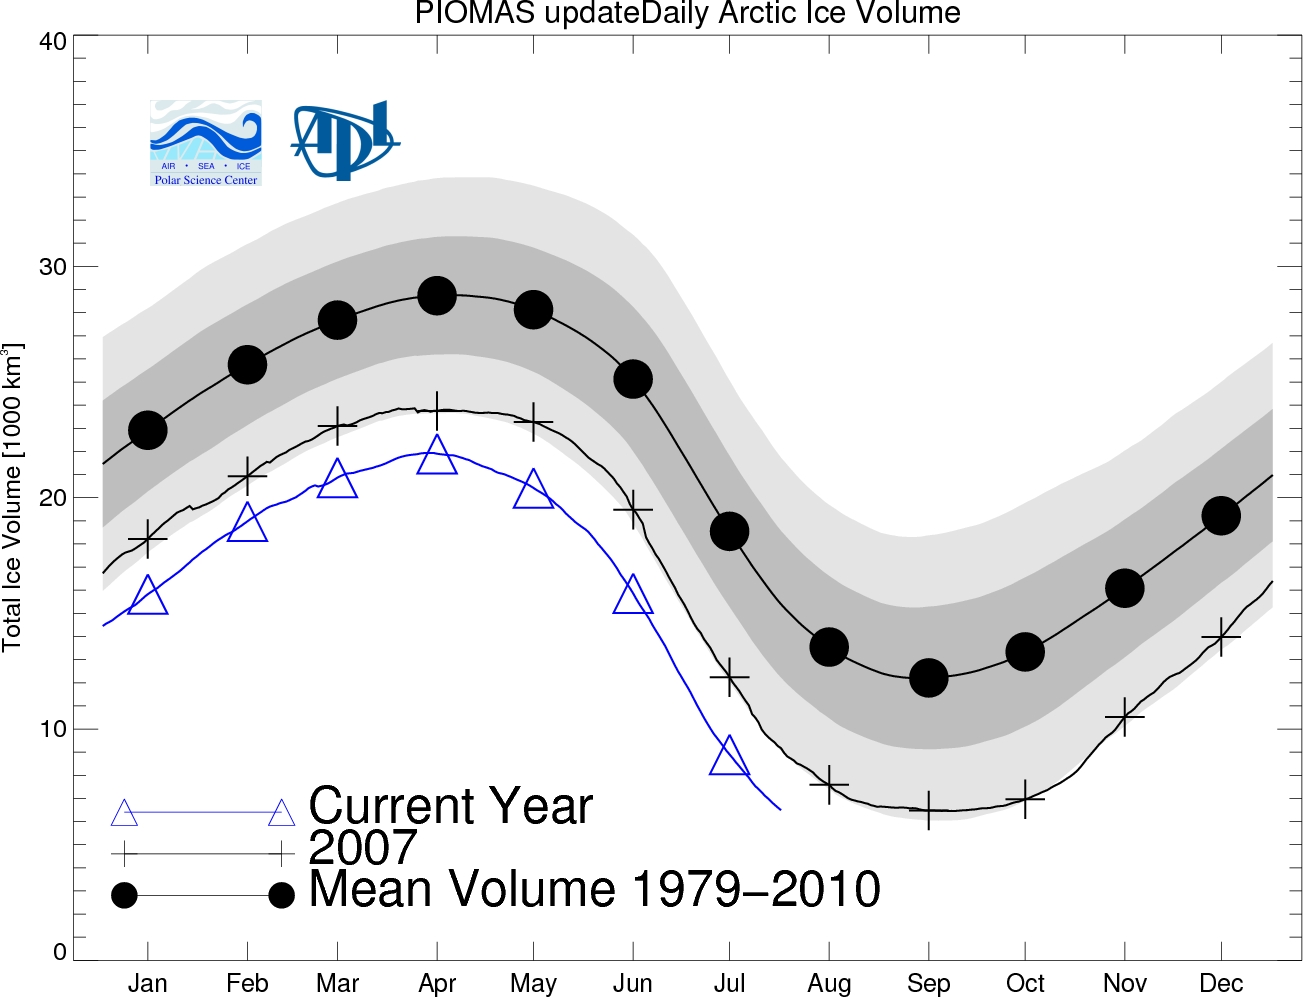
2011 is considerably worse than 2007, the previous record-holder. Here you can clearly see the estimated total volume in thousands of cubic kilometers, and how it changes with the seasons:
As the Arctic melts, many things are changing. The fabled Northwest Passage is becoming a practical waterway, so battles are starting to heat up over who controls it. The U.S. and other nations see it as an international waterway. But Canada says they own it, and have the right to regulate and protect it:
• Jackie Northam, Arctic warming unlocking a fabled waterway, Morning Edition, National Public Radio, 15 August 2011.
But the 800-pound gorilla in the room is the melting permafrost. A lot of the Arctic is covered by permafrost, and it stores a lot of carbon, both as peat and as methane. After all, peat is rotten plant material, and rotting plants make methane. Recent work estimates that between 1400 and 1700 gigatonnes of carbon is stored in permafrost soils worldwide:
• C. Tarnocai, J. G. Canadell, E. A. G. Schuur, P. Kuhry, G. Mazhitova, and S. Zimov, Soil organic carbon pools in the northern circumpolar permafrost region, Global Biogeochemical Cycles 23 (2009), GB2023.
That’s more carbon than currently resides in all living things, and twice as much carbon as held by the atmosphere!
How much of this carbon will be released as the Arctic melts—and how fast? There’s a new paper about that:
• Kevin Schaefer, Tingjun Zhang, Lori Bruhwiler, Andrew Barrett, Amount and timing of permafrost carbon release in response to climate warming, Tellus B 63 (2011), 165–180.
It’s not free, but you can read Joe Romm’s summary. Here’s their estimate on how carbon will be released by melting permafrost:

So, they’re guessing that melting permafrost will release a gigatonne of carbon per year by the mid-2030s. Moreover, they say:
We predict that the PCF [permafrost carbon feedback] will change the Arctic from a carbon sink to a source after the mid-2020s and is strong enough to cancel 42-88% of the total global land sink. The thaw and decay of permafrost carbon is irreversible and accounting for the PCF will require larger reductions in fossil fuel emissions to reach a target atmospheric CO2 concentration.
One of the authors explains more details here:
“The amount of carbon released [by 2200] is equivalent to half the amount of carbon that has been released into the atmosphere since the dawn of the industrial age,” said NSIDC scientist Kevin Schaefer. “That is a lot of carbon.”
The carbon from permanently frozen ground known as permafrost “will make its impact, not only on the climate, but also on international strategies to reduce climate change Schaefer said. “If we want to hit a target carbon concentration, then we have to reduce fossil fuel emissions that much lower than previously calculated to account for this additional carbon from the permafrost,” Schaefer said. “Otherwise we will end up with a warmer Earth than we want.”
The carbon comes from plant material frozen in soil during the ice age of the Pleistocene: the icy soil trapped and preserved the biomass for thousands of years. Schaefer equates the mechanism to storing broccoli in the home freezer: “As long as it stays frozen, it stays stable for many years,” he said. “But you take it out of the freezer and it will thaw out and decay.”
Now, permafrost is thawing in a warming climate and “just like the broccoli” the biomass will thaw and decay, releasing carbon into the atmosphere like any other decomposing plant material, Schaefer said. To predict how much carbon will enter the atmosphere and when, Schaefer and coauthors modeled the thaw and decay of organic matter currently frozen in permafrost under potential future warming conditions as predicted by the Intergovernmental Panel on Climate Change.
They found that between 29-59 percent of the permafrost will disappear by 2200. That permafrost took tens of thousands of years to form, but will melt in less than 200, Schaefer said.
Sound alarmist? In fact, there are three unrealistically conservative assumptions built into this paper:
1) The authors assume the ‘moderate warming’ scenario called A1B, which has atmospheric concentrations of CO2 reaching 520 ppm by 2050 and stabilizing at 700 ppm in 2100. But so far we seem to be living out the A1F1 scenario, which reaches 1000 ppm by century’s end.
2) Their estimate of future temperatures neglects the effect of greenhouse gases released by melting permafrost.
3) They assume all carbon emitted by permafrost will be in the form of CO2, not methane.
Point 2) means that the whole question of a feedback loop is not explored in this paper. I understand why. To do that, you can’t use someone else’s climate model: you need to build your own! But it’s something we need to study. Do you know anyone who is? Joe Romm says:
Countless studies make clear that global warming will release vast quantities of greenhouse gases into the atmosphere this decade. Yet, no climate model currently incorporates the amplifying feedback from methane released by a defrosting tundra.
If we try to understand this feedback, point 3) becomes important. After all, while methane goes away faster than CO2, its greenhouse effect is much stronger while it lasts. For the first 20 years, methane has about 72 times the global warming potential of carbon dioxide. Over the first 100 years, it’s about 25 times as powerful.
Let’s think about that a minute. In 2008, we burnt about 8 gigatonnes of carbon. If Schaefer et al are right, we can expect 1 extra gigatonne of carbon to be released from Arctic permafrost by around 2035. If that’s almost all in the form of carbon dioxide, it makes our situation slightly worse. But if a lot of it is methane, which is—let’s roughly say—72 times as bad—then our situation will be dramatically worse.
But I don’t know how much of the carbon released will be in the form of methane. I also don’t know how much of the methane will turn into other organic compounds before it gets into the atmosphere. I’d really like to know!
I hope you learn more about this stuff and help me out. Here are a few good references available for free online, to get started:
• Edward A. G. Schuur et al, Vulnerability of permafrost carbon to climate change: implications for the global carbon cycle, Bioscience 58 (2008), 701-714.
• David M. Lawrence, Andrew G. Slater, Robert A. Tomas, Marika M. Holland and Clara Deser, Accelerated Arctic land warming and permafrost degradation during rapid sea ice loss, Geophysical Research Letters 35 (2008), L11506.
• Amanda Leigh Mascarelli, A sleeping giant?, Nature Reports Climate Change, 5 March 2009.
The last one discusses the rise in atmospheric methane that was observed in 2007:

It also discusses the dangers of methane being released from ice-methane crystals called methane clathrates at the bottom of the ocean—something I’m deliberately not talking about here, because it deserves its own big discussion. However, there are also clathrates in the permafrost. Here’s a picture by W. F. Kuhs, showing what methane clathrate looks like at the atomic scale:

The green guy in the middle is methane, trapped in a cage of water molecules. Click for more details.
If you know more good references, please tell me about them here or add them to:
• Permafrost, Azimuth Library.


Very good summary on the scientific facts!. I am not an expert on methane so I leave that to comment. I think one way is to understand tipping point dependencies. Eg the feedback between different climate tipping points that the researchers have identified.
Looking into deep time is another that the climate researchers are doing, but I think we need more understanding of how actual past changes from incremental change to tipping point.
Also I think we need more research on tipping point prediction and management
Something odd happens to your picture of a Clathrate molecule, It didn’t display for me until I clicked through, but after I came back it showed OK in the blog.
Good post BTW.
The Siberian tundra is already starting to release methane.
If the deep ocean clathrates start melting, the methane comes up as big flammable bubbles. The bubbles form in deep ocean, and expand as they rise (the pressure on them is proportional to their depth, and they obey Boyle’s law). So they are a potential direct risk to shipping (a ship can fall into and/or ignite a large bubble of methane). .
I don’t get why melting permafrost has to lead to a net increase in atmospheric carbon.
As far as I understand the carbon trapped in permafrost was trapped there when plants and other biological material froze when temperature dropped.
The studies you talk about describe a scenario where permafrost melts and just releases the carbon into atmosphere. That to me sounds like an very simplistic and likely flawed way of looking at the issue.
The way I see it when temperatures rise again the life will simply resume where it stopped. New plants will grow and they will resume sequestering carbon, just as their ancestors did when they put that carbon there in the first place. In other words if anything i would expect the area to be either carbon neutral or a carbon sink.
Of course it may take some years for life to fully take advantage of new conditions but the release of carbon also wouldn’t take place overnight.
Plants sequester carbon during their growing phase, they release it again when they decay. So over the life cycle of a general plant, there is no net sequestration.
This is an interesting remark, what were the climatic and geographic conditions around the Arctic when the carbon was deposited there? (Actually, from a human point of view “life conditions” would have been better in the Arctic in those good old times, i.e. more agreeable temperatures. But I doubt that agreeable temperatures for the Arctic imply agreeable temperatures at other places in the world)
If the area would turn from permafrost into boreal forest, I would expect the methane to be released. The forest itself, would, over its whole lifecycle, be carbon neutral of course. But the release of the methane would not be.
Yes, plants are carbon-neutral over their whole life cycle but that is beside the point.
As long as there are plants they sequester carbon in their tissues, going from no plants to plants is carbon sequestration. So if permafrost were to turn into a forest the growing forest would be a carbon sink (for as long as it were growing, then it would be carbon neutral).
Yes, and when the wood is cut it will become a source again. The carbon balance also depends how fast the forest is logged again and what the wood is used for. But I admit these factors are difficult to estimate (yet I’m not optimistic in that respect) so I don’t mind to accept your supposition that the forest remains pristine. Then it would be interesting to estimate how much forest area is actually needed to sequester an exagram of carbon, and how large the permafrost areas (minus present boreal forests) actually are.
Arrow wrote:
If scientists had done any studies giving credence to this scenario—that the melting permafrost will be “either carbon neutral or a carbon sink”—then I might happily share your optimism. You are hoping that plants will grow on the tundra soon enough and sequester carbon fast enough to remove from the atmosphere, within the next 20-100 years, more carbon than will be emitted by the 1500 gigatonnes of half-rotten plant material, now frozen, that will continue rotting as the permafrost melts. It’s a matter of time scales and specific numbers.
Unfortunately, the published studies I’ve seen don’t support your optimism.
Let me discuss a few, briefly, and provide links so you can read them too. I’ll do just one per comment. Here’s one:
• Katey M. Walter, Laurence C. Smith and F. Stuart Chapin, Methane bubbling from northern lakes: present and future contributions to the global methane budget, Phil. Trans. R. Soc. A 365 (2007), 1657-1676.
In short, they looked at the methane emission of 16 lakes in Siberia and Alaska and used that to estimate the total emissions of similar lakes, getting somewhere between 14 and 34 million tonnes of methane emitted per year now. This will increase as more permafrost melts to form lakes. They
add:
That means tens of gigatonnes from these lakes alone.
(A teragram is a million tonnes.)
Here’s another article, which I already mentioned:
• Amanda Leigh Mascarelli, A sleeping giant?, Nature Reports Climate Change, 5 March 2009.
Some of this is about methane being released from clathrates under the ocean, which is only indirectly relevant to our discussion, but I just want to comment on the rise of atmospheric methane concentrations, as shown here:
After all, this graph is not just a theoretical prediction—this is hard evidence about what’s happening with methane!
At the time, Mascarelli wrote this:
Now at the time, Ed Dlugokencky and James White (a geochemist at the University of Colorado, Boulder) tried to argue that this rise was just some sort of glitch:
However, the rise in methane concentrations continued, as discussed here:
• Michael McCarthy, Methane levels may see ‘runaway’ rise, scientists warn, The Independent. 22 February 2010.
And in fact, Dlugokencky was one of the ones to observe this:
(Emphasis mine.)
I don’t know the state of the art as of 2011. Does someone have an up-to-date graph? This website lists references:
• Ari Jokimäki, Papers on atmospheric methane concentration.
but the latest new measurements listed here seem to date back to around 2009.
Yes, I am optimistic, but as the carbon now sequestered in the permafrost was sequestered there by life, it is a fact that life can sequester at least as much carbon as is there now.
Of course I agree that there are many uncertainties here, the timeframe of sequestration, the climate required and so on and on.
But my main point is simply that the release of carbon from thawing permafrost is only a part of the picture and that the effects of regrowth also have to be taken into account.
Arrow: The timeframe is of course the knack point. Plant and soil life can sequester lots of carbon – but it takes many centuries to make a dent. The effects of regrowth are negligible for any practical purpose – it’s these decades and this century that counts. Currently it looks plant productivity is declining: CO2 boosts plant growth only under favorable conditions.
The effects of regrowth is one of steady state. An impulse release of methane from fast melting permafrost is a huge perturbation on the steady state. Plants evolved to maintain a steady uptake of CO2, and just because the concentration changes doesn’t mean that suddenly more vegetation will sprout up.
Everything will eventually diffuse towards a maximum entropy configuration, but we are talking vastly different time scales, as FFG says. It is fast for the impulse and slow for the response. See the fat-tail curve in my comment below that John kindly reposted. That is the real impulse response that IPCC, Archer, Hooss and others assume, and is straightforwardly modeled by a master diffusion equation.
When the permafrost melts you have a perfect conditions for both anaerobic and aerobic bacteria to thrive… rotting vegetation is perfect microbe food …aerobic bacteria produce CO2 anaerobic bacteria produce methane
Methane emissions have risen in the recent past and according to measurements of atmospheric concentration of CH4, it has risen quite dramatically:
The other point as you say is the residence time of CH4. Even though it is short, it decomposes to CO2 in the end:
But one of the big debates right now concerns the meaning of residence time. CO2 has a residence time of anywhere from 2-10 years, but if you look at the numbers, so does CH4:
The big distinction is that CO2 takes a long time to semi-permanently sequester. That is what the carbon cycle is all about. So to understand methane long term we have to understand the forcing function of CO2.
The following graphic illustrates a slab calculation of CO2 dynamics I did yesterday, which describes the long term excess CO2 levels modeled as an impulse response:
The overall envelope of the CO2 that does not diffuse to the deeper layers into more permanent storage looks very similar to the solution of the Fokker-Planck master equation with no drift. The solution with a normalized diffusion coefficient looks like:
The key term is the lead inverse power law with time. That is a very fat tail which explains the apparent long residence time of CO2. Indeed CO2 will recycle completely in the atmosphere in within 10 years, but the sequestering of excess is much longer. The layer of carbon at the surface is where the mixing takes places and until that gets semi-permanently buried, the excess will keep coming back. (And I say semi-permanently because if it was permanent, we wouldn’t have the carbon cycle over a geologic time span).
So the methane residence time quickly turns into a CO2 residence time after the methane decomposes. And that has implications as a long-term forcing function.
Doing this exercise was a very edifying experience, as I never thought of it this from this perspective. Even though I did all sorts of semiconductor diffusion experiments and calculations working as a postdoc at a research lab, I never made the obvious connection to the solid state situation. It isn’t a residence time in the atmosphere that is important but the fluctuating excess between the atmosphere and surface as the CO2 diffuses underground or to the deep ocean.
John, apologize if I didn’t get the LaTeX right, as this is my first attempt, being a Framemaker guy for years.
Nature’s 11 August 2011 edition had two letters and a view on them concerning methane levels:
Recent decreases in fossil-fuel emissions of ethane and methane derived from firn air, Murat Aydin, Kristal R. Verhulst, Eric S. Saltzman, Mark O. Battle, Stephen A. Montzka et al:
Reduced methane growth rate explained by decreased Northern Hemisphere microbial sources, Fuu Ming Kai, Stanley C. Tyler, James T. Randerson & Donald R. Blake:
Atmospheric science: Enigma of the recent methane budget, Martin Heimann:
The fact that methane concentrations can fluctuate so wildly over time points to a couple of suppositions. First that it is largely driven by natural sources. Secondly, that the methane residence time is thin-tailed, and the breakdown of methane occurs in the atmosphere — it thus doesn’t have the chance to follow a slow diffusional cycle, not having to pass through deep stores like carbon from CO2 does.
All these parts have to be self-consistent for these theories to make sense.
David quoted a paper saying:
That’s interesting! So, perhaps instead of being surprised by the recent upturn here:
we should be surprised by the rather level methane levels from 2000 to 2006, which look very anomalous when set in this bigger picture:
So far no one seems to be able to offer any data on the amount of carbon that could be captured by regrowth on the thawing areas.
Without data it’s just a he said she said argument, yes, I am optimistic and you are pesimistic, no surprise here, but unless someone can come up with reliable numbers we won’t know who is right (or rather all sides will think they are right).
One look at the globe should tell you that the landmass potentially affected is huge, and it is certainly not obvious that the timescale is so long as to make the regrowth irrelevant for this century. Capture starts as soon as growth starts not when there are already old forests.
(And no the effect of regrowth is not one of steady state – growth is not steady state)
It’s not exactly a “he said she said” argument. It’s a “top experts on the subject predict significant methane emissions from melting permafrost, but some guy on my blog says they must be wrong” argument.
I will however make some attempt to learn more about what increased plant growth is expected and to what extent this has already been studied. I haven’t looked yet.
I also think it would be interesting to learn more about when the massive peat bogs in the Arctic formed in the first place—and what conditions prevailed then. The past may be a guide to the future, though we’re rapidly moving into climate conditions that haven’t been seen for quite a while.
John, yours is certainly not a fair way to put it.
I never once said that studies on methane emissions are wrong, I am arguing about a whole different matter – that methane emissions are just a part of the picture and that another potentially significant part – capture of carbon by increased plant growth – may help offset those emissions.
I haven’t seen any experts on the latter issue cited here, I happen to be a biologist myself but of the molecular variety so I have no relevant expertise to offer either. This is why I say that without proper data or studies cited the issue will IMO remain unresolved.
I am happy that you will try to look further into it.
Arrow said:
We are trying to collect this information on our pages Carbon dioxide fertilization and Climate forcing and feedback (section Vegetation growth). These pages are still “work in progress”… If you have additional scientific references on the subject we will put them there.
Arrow wrote:
Not in precisely those words. You said they were “very simplistic and most likely flawed”:
And while Schaefer et al predicted that the Arctic will become a massive carbon source, you predicted it will be carbon neutral, or a carbon sink. In other words, they’re wrong.
But never mind. I will try to learn more about this stuff… not mainly to win this argument, but because I think the subject is important.
We’ve been talking about this paper:
• Kevin Schaefer, Tingjun Zhang, Lori Bruhwiler, Andrew Barrett, Amount and timing of permafrost carbon release in response to climate warming, Tellus B 63 (2011), 165–180.
Remember, this is the paper that predicts these rising carbon emissions from melting permafrost:
But what does this paper have to say about the role of plant growth?
First, the authors clearly consider plant growth important, because they say:
(Emphasis mine.)
But what do they do differently, to take plant photosynthetic uptake into account?
It’s a bit of a digression, but I can’t resist explaining the jargon here. If the mean annual air temperature is only slightly below freezing, permafrost will form only in spots that are sheltered, with a northerly view. This creates what is known as discontinuous permafrost. Usually, permafrost will remain discontinuous in a climate where the mean annual soil surface temperature is between -5 and 0 °C. At mean annual soil surface temperatures below −5 °C, the permafrost stops being patchy, and a zone of continuous permafrost forms.
But what the heck is SiBCASA?
So, their work includes a model of plant photosynthesis. Needless to say, it would take a while to understand it!
Some relevant references in the paper include:
• Collatz, G. J., Ball, J. T., Grivet, C. and Berry, J. A. 1991. Physiological and environmental regulation of stomatal conductance, photosynthesis, and transpiration: a model that includes a laminar boundary layer. Agric. Forest Meteorol. 54, 107–136.
• Collatz, G. J., Ribascarbo, M. and Berry, J. A. 1992. Coupled photosynthesis-stomatal conductance model for leaves of C4 plants. Aust. J. Plant Physiol. 19, 519–538.
• Cramer, W., Bondeau, A., Woodward, F. I., Prentice, I. C., Betts, R. A., and co-authors. 2001. Global response of terrestrial ecosystem structure and function to CO2 and climate change: results from six dynamic global vegetation models. Global Change Biol. 7, 357–373.
• Farquhar, G. D., von Caemmerer, S. and Berry, J. A. 1980. A biochemical model of photosynthetic CO2 assimilation in leaves of C3 species. Planta. 149, 78–90.
• Kicklighter, D. W., Bruno, M., Donges, S., Esser, G., Heimann, M., and co-authors. 1999. A first-order analysis of the potential role of CO2 fertilization to affect the global carbon budget: a comparison of four terrestrial biosphere models. Tellus B 51, 343–366.
By the way, C3 photosynthesis and C4 photosynthesis are two different pathways whereby plants take carbon out of the air. Plants that use C4 are newer—and they do better in conditions of drought, high temperatures, or limited nitrogen or CO2. They showed up sometime around 25–32 million years ago during the Oligocene, but they didn’t become ecologically significant until around 6–7 million years ago, in the Miocene Period. the most famous are the grasses! They now constitute about 5% of Earth’s plant biomass, but they do about 30% of the carbon fixation.
So the red graph above already takes photosynthesis into account? Or is the model they speak of from a different publication?
The red graph takes photosynthesis into account, using the SiBCASA model I described in this comment of mine. That graph, and all the quotes and references in that comment of mine, all come from the same paper:
• Kevin Schaefer, Tingjun Zhang, Lori Bruhwiler, Andrew Barrett, Amount and timing of permafrost carbon release in response to climate warming, Tellus B 63 (2011), 165–180.
I will go back and edit that comment of mine to make this clearer.
John wrote:
Maybe I missed that point, but it seems you are mainly discussing the release of greenhouse gases. Do the studies also include a possible intake of oxygen like from aerobic organisms which could change the percentage of greenhouse gas vs oxygen? I am not sure but I think that something like that led some time ago to the abort of some simulations in the Mars analogue research station programme
As a side remark, when discussing this problem I linked to a (german) article by Spiegel, which links to another article in which there is the mention of an article in nature (427, S. 245,2005, I have no access to this journal) by Pat Bellamy of the National Soil Resources Institute of Cranfield University and four collegaues which seems to claim that even British soil is losing carbon.
Bellamy, Loveland, Bradley, Lark and Kirk, Carbon losses from all soils across England and Wales 1978−2003 Nature (2005) 437
Re grasping the straw of increased plant growth, Bellamy et al say it:
So, it’s not only outgassing permafrost:
Higher temp → higher soil metabolism → soil loses carbon.
Soil is where most carbon gets stored. E.g. massive reforestation alone would not solve the climate problem. But a massive build-up of soil could help. The key to the future (if Homo S “Sapiens” is at all interested) would be a carbon negative agriculture building soil instead of destroying it.
[…] There is currently a discussion about melting permafrost on Azimuth. If frozen soil is melted then usually greenhouse gases are going to be emitted. So in this context […]
Martin Gisser (better known as Florifulgurator) has posted some pictures of the melting Arctic coast on the Azimuth Wiki.
• Forbes, D.L. editor, State of the Arctic Coast 2010 – Scientific Review and Outlook, International Arctic Science Committee, Land-Ocean Interactions in the Coastal Zone, Arctic Monitoring and Assessment Programme, International Permafrost Association. Helmholtz-Zentrum, Geesthacht, Germany, 2011, 178 pp.
• Andrew Prince, Washing away the Arctic coastline, National Public Radio, 9 April 2011.
Click to enlarge.
Andrew Prince writes:
[…] Azimuth fears tipping points, QED Insight rants a bit and then gives his opinion on how science and beliefs can coexist, Mind […]
In August, the volume of sea ice in the Arctic Ocean hit a new record low. The graph here says it all… and this isn’t one of those fake graphs where the bottom is far from zero. Here the bottom of the graph means no ice:
Click for details.
Joseph Romm has made a $1000 bet that by 2020, sea ice in the Arctic will be almost gone in the summer.
Here’s another one of those not fake graphs showing a new area record (Cryosphere Today data).
PS Greetings to Florifulgurator!
Hey! Everybody, look! That’s Neven, the dude whose Arctic Sea Ice Blog is the place to go if you’re interested in news on this subject!
I’m glad you stopped by.
For anyone too lazy to click Neven’s link, here’s Larry Hamilton’s graph of the minimum area of Arctic sea ice each year:
Note that area is descending more slowly than volume. It’s easier to measure but ultimately less important.
Thanks, John. I tried to insert that image myself, but failed.
What’s interesting is that when we combine both these graphs, we can deduce that on average the sea ice in the Arctic is 1.5 meters thick (4.3 million km3/2.9 million km2). This correlates with the snippets of information we get from a couple of buoys in the Beaufort Sea (a thickness of approximately 80 cm) and measurements that was done by the scientists aboard the icebreaker Polarstern (90 cm on average around the North Pole).
We could be tempted to conclude that the PIOMAS model overestimates total ice volume, but we have to keep in mind that the multiyear ice is much thicker and makes the average higher.
Sorry, Neven—this free WordPress blog blocks anyone other than me from including images in comments.
I was imagining trying to estimate the average rate at which the Arctic ice was thinning by simply dividing the volume by the area. The volume is decreasing faster than the area, so we would indeed see it thinning. But I was too lazy to do the calculation. I’m glad the average thickness comes out as something reasonable.
Well, we shouldn’t it take them as gospel truth, and hopefully CryoSat-2 can give us some more definite numbers (and of course uncertainty cuts both ways), but I don’t think the PIOMAS model is off by much.
Greetings, Neven!
It’s perhaps time we meet again in person…
(Yeah, funny little planet! Some time back, before Neven got famous, we found out to constitute the totality of George Mobus’s blog readers dwelling in Bavaria. And so he visited my little garden above the Danube. Meanwhile we both have moved.)
[…] Some Arctic lakes are shrinking. Why? One possibility: warmer temperatures and higher winds could cause more evaporation. Another: melting permafrost could let lake water soak into thawed soil. The scientist involved, Mark Carroll at the University of Maryland in College Park, “is not aware of any evidence that the permafrost in the far north is melting yet”. Hmm—compare my article Melting Permafrost. […]
[…] a nightmare scenario: global warming melts permafrost and icy deposits called ‘methane clathrates’ on the ocean floor. These release large […]