guest post by Tim van Beek
The Case of the Missing 33 Kelvin, Continued
Last time, when we talked about putting the Earth in a box, we saw that a simple back-of-the-envelope calculation of the energy balance and resulting black body temperature of the earth comes surprisingly close to the right answer.
But there was a gap: the black body temperature calculated with a zero-dimensional energy balance model is about 33 kelvin lower than the estimated average surface temperature on Earth.
In other words, this simplified model predicts an Earth that’s 33 °C colder than it really is!
In such a situation, as theoretical physicists, we start by taking a bow, patting ourselves on the back, and congratulating ourselves on a successful first approximation.
Then we look for the next most important effect that we need to include in our model.
This effect needs to:
1) have a steady and continuous influence over thousands of years,
2) have a global impact,
3) be rather strong, because heating the planet Earth by 33 kelvin on the average needs a lot of power.
The simplest explanation would of course be that there is something fundamentally wrong with our back-of-the-envelope calculation. 
One possibility, as Itai Bar-Natan mentioned last time, is geothermal energy. It certainly matches point 1, maybe matches point 2, but it is hard to guess if it matches point 3. As John pointed out, we can check the Earth’s energy budget on Wikipedia. This suggests that the geothermal heating is very small. Should we trust Wikipedia? I don’t know. We should check it out!
But I will not do that today. Instead I would like to talk about the most prominent explanation:
Most of you will of course have heard about the effect that climate scientists talk about, which is often—but confusingly—called the ‘greenhouse effect’, or ‘back radiation’. However, the term that is most accurate is downward longwave radiation (DLR), so I would like to use that instead.
In order to assess if this is a viable explanation of the missing 33 kelvin, we will first have to understand the effect better. So this is what I will talk about today.
In order to get a better understanding, we will have to peek into our simple model’s box and figure out what is going on in there in more detail.
Peeking into the Box: Surface and Atmosphere
To get a better approximation, instead of treating the whole earth as a black body, we will have to split up the system into the Earth itself, and its atmosphere. For the surface of the Earth it is still a good approximation to say that it is a black body.
The atmosphere is more complicated. In a next approximation step, I would like to pretend that the atmosphere is a body of its own, hovering above the surface of the earth, as a separate system. So we will ignore that there are several different layers in the atmosphere doing different things, including interactions with the surface. Well, we are not going to ignore the interaction with the surface completely, as you will see.
Since one can quickly get lost in details when discussing the atmosphere, I’m going to cheat and look up the overall average effects in an introductory meteorology textbook:
• C. Donald Ahrens: Meteorology Today, 9th edition, Brooks/Cole, Florence, Kentucky, 2009.
Here is what atmosphere and Earth’s surface do to the incoming radiation from the Sun (from page 48):

Of 100 units of inbound solar energy flux, 30 are reflected or scattered back to space without a contribution to the energy balance of the Earth. This corresponds to an overall average albedo of 0.3 for the Earth.
The next graphic shows the most important processes of heat and mass transport caused by the remaining 70 units of energy flux, with their overall average effect (from page 49):

Maybe you have some questions about this graphic; I certainly do.
Conduction and Convection?
Introductory classes for partial differential equations sometimes start with the one dimensional heat equation. This equation describes the temperature distribution of a rod of metal that is heated on one end and kept cool on the other. The kind of heat transfer occurring here is called conduction. The atoms or molecules stay where they are and transfer energy by interacting with their neighbors.
However, heat transfer by conduction is negligible for gases like the atmosphere. Why is it there in the graphic? The answer may be that conduction is still important for boundary layers. Or maybe the author wanted to include it to avoid the question “why is conduction not in the graphic?” I don’t know. But I’ll trust that the number associated with the “convection and conduction” part is correct, for now.
What is Latent Heat?
There is a label “latent heat” on the left part of the atmosphere: latent heat is energy input that does not result in a temperature increase, or energy output that does not result in a temperature decrease. This can happen, when there is a phase change of a component of the system. For example, when liquid water at 0°C freezes, it turns into ice at 0°C while losing energy to its environment. But the temperature of the whole system stays at 0°C.
The human body uses this effect, too, when it cools itself by sweating. This cooling effect works as long as the fluid water turns into water vapor and withdraws energy from the skin in the process.

The picture above shows a forest with water vapor (invisible), fluid (dispersed in the air) and snow. As the Sun sets, parts of the water vapor will eventually condense, and fluid water will turn into ice, releasing energy to the environment. During the phase changes there will be energy loss without a temperature decrease of the water.
Downward Longwave Radiation
When there is a lot of light there are also dark shadows. — main character in Johann Wolfgang von Goethe’s Götz von Berlichingen
Last time we pretended that the Earth as a whole behaves like a black body.
Now that we split up the Earth into surface and atmosphere, you may notice that:
a) a lot of sunlight passes through the atmosphere and reaches the surface, and
b) there is a lot of energy flowing downwards from the atmosphere to the surface in form of infrared radiation. This is called downward longwave radiation.
Observation a) shows that the atmosphere does not act like a black body at all. Instead, it has a nonzero transmittance, which means that not all incoming radiation is absorbed.
Observation b) shows that assuming that the black body temperature of the Earth is equal to the average surface temperature could go wrong, because—from the viewpoint of the surface—there is an additional inbound energy flux from the atmosphere.
The reason for both observations is that the atmosphere consists of various gases, like O2, N2, H2O (water vapor) and CO2. Any gas molecule can absorb and emit radiation only at certain frequencies, which are called its emission spectrum. This fact led to the development of quantum mechanics, which can be used to calculate the emission spectrum of any molecule.
Molecules and Degrees of Freedom
When a photon hits a molecule, the molecule can absorb the photon and gain energy in three main ways:
• One of its electron can climb to a higher energy level.
• The molecule can vibrate more strongly.
• The molecule can rotate more rapidly.
To get a first impression of the energy levels involved in these three processes, let’s have a look at this graphic:

This is taken from the book
* Sune Svanberg, _Atomic and Molecular Spectroscopy: Basic Aspects and Practical Applications_, 4th edition, Advanced Texts in Physics, Springer, Berlin, 2004.
The y-axis shows the energy difference in ‘eV’, or ‘electron volts’. An electron volt is the amount of energy an electron gains or loses as its potential changes by one volt.
Accoding to quantum mechanics, a molecule can emit and absorb only photons whose energy matches the difference of one of the discrete energy levels in the graphic, for any one of the three processes.
It is possible to use the characteristic absorption and emission properties of molecules of different chemical species to analyze the chemical composition of an unknown probe of gases (and other materials, too). These methods are usually called names involving the word ‘spectroscopy’. For example, infrared spectroscopy involves methods that examine what happens to infrared radiation when you send it to your probe.
By the way, Wikipedia has a funny animated picture of the different vibrational modes of a molecule on the page about infrared spectroscopy.
But why does so much of radiation from the Sun pass through the atmosphere, while a lot of infrared radiation emitted by the Earth instead bounces back to the surface? The answer to this puzzle involves a specific property of certain components of the atmosphere.
Can You See an Electron Hopping?
Here is a nice overview of the spectrum of electromagnetic radiation:

The energy 


where 

Planck’s constant is

while the speed of light is

Plugging these into the formula we get that a photon with an energy of one electron volt has a wavelength of about 1.2 micrometers, which is just outside the visible range, a bit towards the infrared direction. The visible range corresponds to 1.6 to 3.4 electron volts. If you want, you can scroll up to the graphic with the energy levels and calculate which processese will result in which kind of radiation.
Electrons that take a step down the orbital ladder in an atom emit a photon. Depending on the atom and the kind of transition, some of those photons will be in the visible range, and some will be in the ultraviolet.
There is no Infrared from the Sun (?)
From the Planck distribution, we can determine that the Sun and Earth, which are approximately black bodies, emit radiation mostly at very different wavelengths:

This graphic is sometimes called ‘twin peak graph’.
Oversimplifying, we could say: The Earth emits infrared radiation; the Sun emits almost no infrared. So, if you find infrared radiation on earth, you can be sure that it did not come from the Sun.
The problem with this statement is that, strictly speaking, the Sun does emit radiation at wavelengths that are in the infrared range. This is the reason why people have come up with the term near-infra-red radiation, which we define to be the range of 0.85 and 5.0 micrometer wavelength. Radiation with longer wavelengths is called far infrared. With these definitions we can say that the Sun radiates in the near-infra-red range, and earth does not.
Only certain components of the atmosphere emit and absorb radiation in the infrared part. These are called—somewhat misleadingly—greenhouse gases. I would like to call them ‘infrared-active gases’ instead, but unfortunately the ‘greenhouse gas’ misnomer is very popular. Two prominent ones are H2O and CO2:

The atmospheric window at 8 to 12μm is quite transparent, which means that this radiation passes from the surface through the atmosphere into space without much ado. Therefore, this window is used by satellites to estimate the surface temperature.
Since most radiation coming from the Earth is infrared, and only some constituents of the atmosphere react to it—excluding the major ones—a small amount of, say, CO2 could have a lot of influence on the energy balance. Like being the only one in a group of hundreds with a boom box. But we should check that more thoroughly.
Can a Cold Body Warm a Warmer Body?
Downward longwave radiation warms the surface, but the atmosphere is colder than the surface, so how can radiation from the colder atmosphere result in a higher surface temperature? Doesn’t that violate the second law of thermodynamics?
The answer is: no, it does not. It turns out that others have already taken pains to explain this on the blogosphere, so I’d like to point you there instead of trying to do a better job here:
• Roy Spencer, Yes, Virginia, cooler objects can make warmer objects even warmer still, 23 July 2010.
• The Science of Doom, The amazing case of “back-radiation”, 27 July 2010.
It’s the Numbers, Stupid!
Shut up and calculate! — Leitmotiv of several prominent physicists after becoming exhausted by philosophical discussions about the interpretation of quantum mechanics.
Maybe we have succeeded by now to convince the imaginary advisory board of the zero dimensional energy balance model project that there really is an effect like ‘downward longwave radiation’. It certainly should be there if quantum mechanics is right. But I have not explained yet how big it is. According to the book Meteorology Today, it is big. But maybe the people who contributed to the graphic got fooled somehow; and there really is a different explanation for the case of the missing 33 kelvin.
What do you think?
When we dip our toes into a new topic, it is important to keep simple yet fundamental questions like this in mind, and keep asking them.
In this case we are lucky: it is possible to measure the amount of downward longwave radiation. There are a lot of field studies, and the results have been incorporated in global climate models. But we will have to defer this story to another day.


This post is great! I can’t express how happy I am that someone else has started writing a series of blog posts here on Azimuth. With one person blogging, it’s just somebody’s personal blog. With two or more, the blog starts becoming a center of activity. That’s how it works at the n-Category Café, and that’s what I want to see here.
If anyone else wants to join in, please let me know.
I’m also delighted that Tim has revealed himself as an science expositor of the first class, with that combination of precision, humor, and humility that’s required for really fun, interesting explanations.
I like this deductive approach. Putting all sorts of evidence together really helps. One interesting bit is the Milankovitch cycles. If you believe the historical record of CO2 and temperature data, one can perhaps partition the effects of the cross-sectional flux changes (the cycles are slight changes in the distance and tilt of the earth with respect to the sun) with the CO2 changes. The long-term CO2 changes are largely quasi-equilibrium/feedback due to the cycles and tend to amplify the temperature according to the theory (with a ~1000 year fat-tail lag on top of a 100,000 year interglacial cycles).
http://www.skepticalscience.com/images/Milankovitch_Cycles_400000.gif (the Vostok ice core evidence)
The easiest thing to do right now based on Tim’s Part 1 is to do the Planck energy balance and assume no feedback with the delta elliptical changes in the orbital distance from the sun. Compare this difference (likely small) against the +/- 5 degree K changes in the earth’s average temperature. That would help to understand some of the missing 33 kelvin.
My own interest has been in working the CO2 impulse response to the fossil fuel forcing function. I am able to pin down the quasi-equilibrium baseline CO2 at 294 ppm instead of the generally accepted 280 ppm.
I blogged it originally here:
http://mobjectivist.blogspot.com/2010/05/how-shock-model-analysis-relates-to-co2.html
with some better equation markup in my online book, but this gives the general idea.
We are at the peak of the historical Milankovitch cycle and according to the records, CO2 has never exceeded 295 ppm over the last 400,000 years. So at the bottom of the cycle, the missing 33K turns into only a missing 23K, right? That is the chain of evidence I would follow, working it from both ends of the candle, the solar flux evidence on one end and the CO2 evidence at the other.
We have talked about the Milankovitch cycles on Azimuth, too. There is an interesting explanation of glacial periods that uses an energy balance model with a temperature dependent albedo. This model has two stable states. An erratic switching between these two states can be explained with stochastic resonance. Someday we’ll blog about this, I hope…it is possible to explain some important points with these simple models.
For example that a positive “runaway” feedback does not lead to an infinite change of the system :-)
But the really important topic I would like to talk about next is how big the DLR effect is, how it depends on the composition of the atmosphere, and what effect a change in the concentration of greenhouse gases has.
OK, so I am working this out, having not done this before. The elliptical changes in the orbit over time cause the earth’s average distance to the sun to change by 5% (a high eccentricity of 0.058 and a low eccentricity of 0.005). This leads to a cross-sectional flux change of 10%. From the Stefan-Boltzmann power-law this causes a 7 degree K swing from low to high over these long-term cycles.
The historical changes over the 100,000 year cycles are 10 degree K, so this actually seems order of magnitude significant. The equilibrium CO2 levels change from 190 PPM to 290 PPM (according to the Vostok cores) corresponding to this variation. According to the Arrhenius law this would give an activation energy for CO2 partial pressures of about 0.3 eV or about 30 kJ/mol, nothing extraordinary about that kind of value.
This gets us back full circle to what Arrhenius himself had originally said about greenhouse gases:
So the point of this discussion is to show how CO2 could act as a lag indicator when temperature changes through solar variations, or as a lead indicator which would force temperature changes by its potency as a greenhouse gas. That is where much of the confusion lies, as historically one can find it difficult to discern causal effects of CO2. But now today, we need to establish it completely as a causative agent.
As long as we are starting from first principles here, does anyone else think that this line of reasoning has some merit? Or does paleoclimatology only bring up a pile of red herrings?
We’ve discussed the Milankovitch cycle / ice age cycle connection quite extensively on the Azimuth Forum and we’ll do a bunch of blog posts about it here. For now, one quick remark. To first order, a change in the eccentricity in the Earth’s orbit causes no net change in the total annual solar power hitting the Earth. So, I don’t believe your back-of-the envelope calculation! I wish it were that easy to see how Milankovitch cycles caused ice ages, but I think it’s much more tricky.
OK, if the details make sense to you. I just noticed the solar radiance can change about +/- 10% in erratic spans of 10,000 years, which seems quite the forcing function. I was going to look some more on http://azimuthproject.org for the Milankovitch and Insolation entries but the server does not seem to be responding.
It seems to be working now:
Milankovitch cycle.
The change in the forcing, i.e. solar inbound energy flux, should be in one of the papers cited there. But can there be changes that result in 10°C difference? I thought that the temperature difference of an ice age and an interglacial is only about 5°C?
It looks like there are some bad graphs out there. The one I linked to above shows a 10 degree K change so that appears twice the range of other sets of data.

My comment on the solar radiance changing about +/- 10% is duplicated on the Azimuth page describing Insolation.
Lots of opportunities for one to do integrations over time spans and latitudes with different albedos to generate at least the naive first-order model. I would like to see an order-of-magnitude forcing function even if it is a fraction of a degree. I do believe in the idea of amplification and resonance but would like to get a handle on the size of the stimulus beforehand.
Like I said, I just started learning about this side of the problem and will need to work things out a bit before I can apply some of my expertise in stochastic problem solving.
WebHubTel wrote:
The Azimuth Wiki is down again—it’s been a bit flakey lately, I’m afraid. So, I can’t quite tell what you mean, especially because I don’t know what you mean by ‘solar radiance’.
Solar radiance sounds like the power per area emitted by the Sun. There are small variations in this: supposedly it’s fluctuated by about 0.1-0.2% in the last 2000 years. I strongly doubt it’s varied by anywhere near as much as 10% in the last 30 million years!
So, I bet you’re really talking about solar irradiance, which means the power per area hitting the Earth, either at the top of the atmosphere or some other specified location. This varies much more, at various frequencies, due to phenomena such as ‘night’, ‘seasons’ and ‘Milankovich cycles’.
In our discussion of Milankovitch cycles on the Azimuth Wiki, we mainly talk about the daily-averaged power hitting the top of the Earth’s atmosphere at a specified latitude and a specified season. This is called
Most of the discussion conventionally focuses on at 65 degrees north at the summer solstice. For example, that’s what the black curve on this graph shows. There’s nothing magic about 65 degrees north, of course.
Yes, there is a lot of fun stuff to study here. The Azimuth Wiki page on insolation gives a lot of the basic formulas you’d need for this, and the page on Milankovitch cycles links to a website that tells you all the numbers you’d need to use these formulas!
The Azimuth wikipage on insolation is pretty much the same information as on Wikipedia and it includes the same graph for 65 north latitude. However, the Azimuth is better because it does allow some editorial comment, such as asking where that graph came from.
Tim says:
I checked some more and every graph I could find shows approximately a 10°C rise after deglaciation.
That upper value must be like a rail that the positive feedback hits before starting back down. In engineering parlance, a rail is some physical effect that limits positive feedback from increasing the amplitude of a signal any further.
What bothers me is what does it mean if we are on this rail right now? In other words, any further CO2 increase will not budge us much beyond this peak we sit at during the current interglacial?
The rail! I wonder what it is: Some complex combination of geobiophysical feedbacks, or something one could easily model? The frightening thing: We might well have punched through the rail. Where/what is the second rail behind it?
I can definitely see the idea of punching through. In for example an operational amplifier system, and under positive feedback, the rails are defined by the positive and negative voltage limits of the power supply. So that is a definite physical limit for a feedback system, in that no energy remains past the punch-through point and the output signal always clamps at those voltage limits.
On the other hand, the solar/climate system has a softer cushion on the limiting effect and who really knows if this first interglaciation rail is the ultimate stopper.
WebHubTel wrote:
I’m not sure where you’re getting that. The black curve here shows the average watts/meter2 of solar radiation hitting the top of the Earth’s in the Northern hemisphere in summer:
(As usual, click to enlarge—and also to see more explanations of all these curves.)
However, whenever that quantity goes up the power of solar radiation hitting the Northern hemisphere in the winter goes down!!!
So, while the black curve wiggles by 10% or more, the total power of the radiation hitting the Earth changes by much less. And that creates a fascinating mystery. For more on this, read my longer, more detailed comment.
Tim van Beek wrote:
That’s right. Here are some charts that might help.
First, a graph of sea temperatures over the last 1.35 million years:
Note the timeline is not to scale! This is from a study that claims that after warming up 0.2° C per year for the last 3 decades, the Earth is now the hottest it’s been in the last 12,000 years:
• James Hansen, Makiko Sato, Reto Ruedy, Ken Lo, David W. Lea, and Martin Medina-Elizade,Global temperature change, Proc. Nat. Acad. Sci. 103 (2006), 14288-14293.
Second, a rougher graph of temperatures over the last 1 million, 150 thousand, 16 thousand and 150 years:
Here "ka" is an abbreviation for "thousands of years ago". These temperatures are estimated by various methods;I got this chart from:
• Barry Saltzman, Dynamical Paleoclimatology: Generalized Theory of Global Climate Change, Academic Press, New York, 2002, fig. 3-4.
As we keep zooming in towards the present we keep seeing more detail:
• Over the last million years there have been about ten Ice Ages – though counting Ice Ages is a bit like counting "really deep valleys" in a hilly landscape.
• From 150 to 120 thousand years ago it warmed up rather rapidly. From 120 thousand years ago to 16 thousand years ago it cooled down: that was the last Ice Age. Then it warmed up rather rapidly again.
• Over the last 10 thousand years temperatures have been unusually constant.
• Over the last 150 years it’s been warming up slightly but rapidly.
I believe that for all three types of Milankovitch cycles (changes in the eccentricity, changes in obliquity and precession), the change in the average amount of solar radiation hitting the Earth is zero to first order.
This is one reason the ice age puzzle is so interesting.
For example, consider eccentricity. When the Earth’s orbit becomes a more eccentric ellipse, the Earth gets closer to the Sun for some of each year, but it gets farther for the rest of the year. If we assume the Earth’s orbit is almost circular and assume the change in eccentricity is small, I believe these two effects almost cancel!
This is a problem in calculus which we should do here someday.
There is a second-order effect that makes increased eccentricity warm the Earth. This becomes obvious in the limit where the eccentricity becomes very large. Why? Because the amount of radiation when the Earth’s distance from the Sun is is proportional to
The smallest this function gets is zero, but it gets arbitrarily large. So if we imagine an Earth that zips in towards the orbit of Mercury and then far from the Sun, the excess heat during the hot part of the year will count for more than the cold during the cold part.
So, we could turn to second-order effects…
However, my readings suggest that nobody tries to explain ice ages as a result of changes in the annual average amount of solar radiation hitting the Earth. Instead, they try to explain them using changes in the amount of solar radiation hitting the Northern hemisphere in the summer!
To first order, when the amount of solar radiation hitting the Northern hemisphere in the summer goes up, the amount of solar radiation hitting the Northern hemisphere in the winter goes down by a corresponding amount!
This is why the puzzle is subtle and interesting. We need to understand things like: does a warmer winter and a correspondingly colder summer tend to create more snow, thus making the Earth whiter and thus colder… or does it tend to make less snow?
And: how does the difference between the Northern hemisphere and Southern hemisphere affect the Earth’s climate? The Arctic is very different from the Antarctic, and this could be crucial. Indeed, it seems that the ice ages started when Antarctica separated from Australia. The existence of an Arctic Ocean surrounded by land may also be important.
For more, I really recommend this article, which is free online:
• Michel Crucifix, Glacial-interglacial cycles, in Springer Encyclopaedia of Snow, Ice and Glaciers.
Here’s a relevant piece:
So, you can see that this subject is very complicated… and interesting.
John asked:
I would vote for the warm winter and cold summer. I suppose the big change in albedo depends on whether snow or ice is present or not, and not really how cold it is (incidentally, albedo is the highest for fresh snow). I would say that a cold summer leads to less melting in the summer, so there’s more surface which has a high albedo. I don’t think a warmer winter leads to less snowcover – as long as the average winter temperature is below zero – because it probably leads to more snow too, simplistically based on the fact that cold air is dryer than warm air.
Besides, because the insolation is higher in summer, a change in albedo during the summer months has a bigger influence on the energy budget than the same change in albedo during the winter months.
What’s the line of reasoning to support the other option?
Concerning the question of which is more likely to create a high ice albedo effect—warm winter and cold summer, or cold winter and warm summer—Frederik wrote:
Me too, and this seems to be the standard theory now—for pretty much the reasons you list!
I don’t know. If you look at Crucifix’s history quoted above you’ll see this other option was James Croll’s original choice, back around 1875. I haven’t read his paper, but that would be very fun to do.
I would also like to read Milankovitch’s original work. This sounds fun:
Note also that all this work is biased towards the Northern hemisphere! One also needs to think about the Southern hemisphere.
Decreasing the obliquity, or tilt of the Earth, causes:
• warmer winters and colder summers in the Northern hemisphere.
• warmer winters and colder summers in the Southern hemisphere.
(Here I’m defining “winter” in the Southern hemisphere to be time that it’s cold there.)
However, obliquity is just one of the Milankovitch cycles. There’s another that affects the time of year that the Earth is farthest from the Sun. Sometimes the Earth’s orbit is aligned in such a way that the Earth is closest to the sun in the Northern hemisphere winter, and farthest in the Southern hemisphere winter. Then we get:
• warmer winters and colder summers in the Northern hemisphere.
• colder winters and warmer summers in the Southern hemisphere.
Note, this is different than the obliquity effect! So I think the whole business is fairly complicated…
Interesting post! I take it that graph illustrating the atmospheric window is a first approximation. Nature can’t be that neat. What would you add to a second approximation? Oxygen and ozone do some absorbing in the window for one thing.
The next approximation step can become quite complicated, since we would have to talk about absorption bands of specific gases, how they depend on temperature, pressure etc., and how to handle overlaps of bands of different gases.
The radiation properties of the atmosphere are not particular;y easy to understand for someone like myself, but as a scientific phenomenon they are very well understood, with a good match between theoretical calculations and experimental results.
I’m currently reading
• Vardavas, Taylor, Radiation and Climate, Oxford Science Publications, Oxford, 2007.
A lot of details can be found there. Maybe I’ll write about it someday…
Hi, David! Good to see you here.
Here’s a supposedly more accurate graph of atmospheric absorption at various wavelengths, taken from Wikipedia:
Beware: this graph is upside-down and backwards compared to the one Tim showed us. Here the ‘infrared window’ Tim was talking about shows up as the high-transmittance region between 8 and 12 micrometers: the big blue patch at right.
I don’t see much detail on this particular graph was generated. In reality it should make a difference how dry or moist the air is, even on a perfectly clear day. H2O is a significant part of the Earth’s atmosphere. So, this graph presumably applies only to some ‘standard’ atmospheric conditions.
Luckily, I’ve seen other more detailed graphs with a lot more documentation on exactly how the graph was generated. I can probably dig them up if necessary.
Maybe this conveys things better. However, it seems to take oxygen and ozone absorption to be stronger than in the graph above.
A very picky point. At Climate forcing and feedback, your
suggests to me you take all gases to cause additional warming. You’d have to remove the final comma if you wanted to say that water vapour and CO2 are gases which causes additional warming (unlike some other gases).
This is some of the best science writing ever, and I am learning so much. Keep up the good work guys!
If you go 5km above sea level, you are above about half the mass of the atmosphere. In some sense it is a midpoint. I guess that a `quantum of warmth’ emitted here will end up half in space and half at the Earth’s surface (on average, roughly speaking).
It gets about 6.5K colder each time you go up 1km, so at 5km, it will be about 5*6.5 K = 32.5 K colder. Is it a coincidence that 32.5 is very close to the the 33 missing Kelvins?
Interesting suggestion. I didn’t know the environmental lapse rate (-6.5 K/km) could be extended that high up, but Wikipedia agrees with you.
Above 10 km the stratosphere begins, where temperature rises (due to ozone). But I guess, in a simplistic model, one could ignore the different atmospheric layers and pretend the whole atmosphere looks somewhat like the troposphere (?)
Suppose all SW radiation reaches the earth’s surface and the atmosphere only interacts with LW. Then (ewoa=earth without atmosphere)
Now, at half the thickness of the atmosphere (no SW is absorbed) there is equal chance for a photon to go up or down (ewa=earth with atmosphere):
since is the energy radiated upwards as well as downwards.
And at the earth’s surface there’s the energy balance:
So and because both depend only on temperature, the temperature at half the thickness of the atmosphere would equal the temperature of an earth without atmosphere. Hence, I think it explains the missing 33 K.
I think I made a mistake: should be replaced by half itself. So there will be a difference between the “middle atmospheric” temperature and the temperature of the earth without atmosphere, but only
  .
.
Can you briefly state what effect this mistake will have on your final result? I’m a bit too lazy to work it out, having just written another long comment full of calculations. Are you saying that instead of explaining the missing 33 K, or at least 32.5 K, this simplified model only explains
of this 33 K? Which of course is not bad….
By the way, your equations didn’t work because you included a backlash before ‘latex’, like this:
$\latex 2+2 = 4$
If you leave out the backslash the you’ll get this:
No, I think it would explain which is much colder (ca. 210 K).
Conclusion: now I’ve taken into account that the blackbody radiates half of its heat in one direction and the other half in the other (instead of radiating the double amount…) the model is no good.
Incidentally, I’ve remembered Nathan’s quote here where he pointed us towards some lecture notes. These discuss a similar (but not the same as I used above, though they come close when you take and
and  ) naive energy balance model, which is claimed to be wrong! Well, in that aspect both models agree…
But Graham’s suggestion about the -32.5 K still seems to good to be pure coincidence.
JB said: “So if we imagine an Earth that zips in towards the orbit of Mercury and then far from the Sun, the excess heat during the hot part of the year will count for more than the cold during the cold part.”
I am not (yet) convinced there is even a second order effect due purely to eccentricity. A planet following a highly eccentric orbit would spend a long time far away, but would moves very quickly when close to the sun. It could be that this cancels out: long long winter, then short blip of very hot summer.
Graham wrote:
Okay, good point. My verbal argument was too sloppy.
On top of the mistake you just mentioned, you can’t really take facts about highly eccentric orbits and use them to conclude that there must be a second-order effect for slightly eccentric orbits. It could be a third-order effect, for example.
I was trying to avoid doing some explicit calculations. But I should do them someday. Of course all this stuff is already known, but it’s good for the soul to do things oneself sometimes. And this is the kind of stuff I’m supposed to be good at.
For example, it would be nice to take an elliptical orbit with eccentricity and integrate
  over a complete orbit, to compute how much solar radiation hits a planet over a complete year. Then, see how this depends on
  .
.
There might even be some cute math here, thanks to this coincidence: not only the solar radiation hitting the planet, but also the gravitational force from the Sun on the planet, is proportional to .
.
So, the integral of the solar radiation over a complete orbit is proportional to the integral of the (radial component of) the gravitational force over one complete orbit. That could lead to some simplifications, maybe.
Yet when you look at the long-term temperature cycles, they appear as faster increases in temperature followed by a slower decay to colder climates. The ice ages almost seem like more the “normal” climate and some forcing function triggers the global climate to the higher temperature regimes.
Is that precisely what the paleoclimatologists are looking for, some forcing function that would trigger an almost spontaneous increase in a greenhouse gas like CO2. Then with the possibility of amplifying feedback and the very long and fat-tailed CO2 residence time, this generates the steep buildup in temperature and followed by the subsequent decline.
To me, it sounds like the consensus trigger is that specific several thousand year period where the Milankovitch parameters line up to yield maximum yearly-averaged global solar radiation absorption.
This is a recent submitted paper “Combined obliquity and precession pacing of the late Pleistocene glacial cycles” by Peter Huybers
Click to access total_draft.pdf
They call the ends of glacial periods, as terminations:
The angular velocity , where
  is the constant orbital angular momentum of the planet and
  is its mass, so if the radiant energy delivered per unit time to the planet is
  for some constant
  , the energy delivered per unit of angular progress around the orbit is
 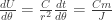 . So the total energy delivered in one period will be
  .
.
How can we relate the orbital angular momentum to the shape of the orbit? If you equate the total energy of the planet, kinetic
  plus potential
  , at its aphelion
  and perihelion
  , and use
  to get the velocity in the kinetic energy term from its distance,
  , when we solve for
  we get:
where is the semi-major axis of the orbit and
  is the semi-minor axis. But we can also relate
  to the period of the orbit,
  , by integrating the rate at which orbital area is swept out by the planet,
  over one orbit. Since the area of an ellipse is
  , this gives us:
Equating these two expressions for shows that the period is:
So the period depends only on the semi-major axis; for a fixed value of , it’s independent of the eccentricity.
If we agree to hold the orbital period , and hence the semi-major axis
  , constant and only vary the eccentricity of the orbit, we have:
Expressing the semi-minor axis in terms of the semi-major axis and the eccentricity, , we get:
So to second order in , we have:
I should have gone on to express this as the average rate of energy delivery over an orbit, which makes all the grungy constants to do with the gravitational dynamics go away and simply gives:
or to second order in
Greg wrote:
Brilliant analysis! We haven’t seen you here much lately… but when there was some actual math that needed to be done, you instantly materialized and elegantly got the job done! Bravo!
So, despite my lapses in logic, it’s really true that:
1) there’s a second-order effect ( ) that makes increased eccentricity warm the Earth,
and
2) in the limit where the Earth’s orbit becomes extremely eccentric ( ), the solar radiation it receives each year becomes extremely large: the quick roasting it gets on its close approach to the Sun outweighs the long cold stretch when it’s far away.
Even better, we can now work out how much the actual changes in the Earth’s orbit affect the amount of solar radiation it gets! According to Wikipedia:
You showed that the total energy the Earth gets each year from solar radiation is proportional to
where is the eccentricity. When the eccentricity is at its lowest value,
  , we get
When the eccentricity is at its highest value, , we get
So, the change is about
In other words, a change of merely 0.167%.
That’s puny! And the effect on the Earth’s temperature would naively be even less!
Naively, we can treat the Earth as a greybody. Since the temperature of a greybody is proportional to the fourth root of the power it receives, a 0.167% change in solar energy received per year corresponds to a percentage change in temperature roughly one fourth as big. That’s a 0.042% change in temperature. If we imagine starting with an Earth like ours, with an average temperature of roughly 290 kelvin, that’s a change of just 0.12 kelvin!
As always, you shouldn’t trust my arithmetic. But the upshot seems to be this: in a naive model without any amplifying effects, changes in the eccentricity of the Earth’s orbit would cause temperature changes of just 0.12 °C!
This is much less than the roughly 5 °C change we see between glacial and interglacial periods. So, we have some explaining to do.
And of course one place to start is to realize that the Earth has not always had glacial periods. Something is happening now that didn’t always happen.
0.12°C seems to be about right, in his review article about stochastic resonance
• Roberto Benzi: Stochastic resonance: from climate to biology.
writes about 0.5°C, but he does not explain this value. If you think about energy balance models with two stable states separated by a potential barrier, like in the double well potential
the interesting question is: What is the ratio of the height of the potential barrier and the external forcing?
Knowing the linear response of the system around the local minima is of no use here :-)
There’s a revised estimate of the historical eccentricity, which has now been reflected in the Wikipedia article:
They get this from:
• J. Laskar, A. Fienga1, M. Gastinea, and H. Manche, “La2010: A New Orbital Solution for the Long-term Motion of the Earth, Astronomy and Astrophysics 532 (2011), A89. PDF online.
Interesting! So the maximum eccentricity is up from previous estimates, while the minimum is down.
One interesting aspect of eccentricity that isn’t apparent from the average insolation is the ratio between insolation at perihelion and insolation at aphelion. This insolation ratio is:
The ratio between naive greybody temperatures is the fourth root of this, which to highest order turns out to be simply:
So for , that’s something like a 17 degree difference in naive greybody temperatures between aphelion and perihelion.
But the phase of aphelion and perihelion relative to the seasons is also significant. Aphelion currently takes place in the northern summer, and the fact that there is more land in the northern hemisphere than the southern — with land having a much lower heat capacity than ocean — makes the average temperature of the Earth higher at aphelion than at perihelion. (Reference)
Interesting. In my old posts about the mathematics of the environment, which you’re now revisiting, I took the celestial mechanics underlying the Milankovitch as a black box, not having time to look into it. I naively assumed it was all worked out. But it’s tricky, especially over long timescales. The abstract of that paper you mentioned gives some clues as to why:
• J. Laskar, A. Fienga1, M. Gastinea, and H. Manche, La2010: A new orbital solution for the long-term motion of the Earth, Astronomy and Astrophysics 532 (2011), A89.
Luckily, 50 million years is enough to study the onset of the glacial cycles we’re experiencing now.
Here’s an example of how the Azimuth Project works, which may not be obvious to people who only follow the Azimuth Blog here, and not also the Azimuth Forum and the Azimuth Wiki.
First Tim wrote a version of the article you see above. He wrote it on the Wiki and informed us about it here on the Forum. Frederik de Roo pointed out a mistake and Tim fixed it. I polished up Tim’s writing a bit and posted his article on the blog here.
When I read it, Tim’s article contained this passage:
I didn’t like how the term ‘dipole moment’ was used without explanation, even though Tim had included a link to Wikipedia. So, I changed this passage a bit, like this:
I considered including some pictures, but in the process I noticed that unlike a water molecule, which looks like this:
a CO2 molecule is more symmetrical:
and thus has dipole moment exactly zero! On the other hand, ozone has nonzero dipole moment even though it’s made of just one kind of atom, because it’s shaped like this:
So, we talked about it on the Forum, and decided to delete the offending paragraph.
So far, this is an example of how we write posts without too many errors.
It’s also an example of why you should join the Azimuth Project if you like explaining science related to environmental issues! It’s fun, and by catching each other’s errors, we can seem smarter than we really are.
But we also got into an interesting discussion about what really does make some gas molecules better at absorbing infrared light! A nonzero dipole moment is not required. So what’s going on?
Our best guess now is that molecules with three or more atoms can bend back and forth, vibrating at infrared frequencies. The only vibrational mode of a diatomic molecule is the obvious ‘stretch-squash’ mode. I think it’s harder to stretch a diatomic molecule apart than to bend a triatomic one: this is just a gut feeling based on playing with tinker toys as a child. If I’m right, this means the ‘stretch-squash’ vibrational mode of a diatomic molecule has a higher frequency than any sort of ‘bending’ mode. So, the frequency of this mode may be up above the infrared range!
There are also the rotational modes, but these tend to have lower frequencies, lying in the microwave range. This seems to confirm another gut feeling of mine: it’s easier to rotate a molecule than bend it or stretch it.
Of course, all these guesses could easily be checked by reading a book on spectroscopy. But maybe someone out there can help us out. Are our guesses on the right track?
I think there should be lecture notes for experimental classes on spectroscopy where this is explained for the molecules of interest here, namely CO2, ozone, O2 etc.
I tried to look it up in several books on spectroscopy but did not find the rule-of-thumb explanation I was looking for.
Hi. I’ve been enjoying this blog since its inception, but this is my first attempt at posting. Hope it helps, and forgive what will undoubtedly turn out to be poor formatting and mark-up.
I’m no expert on these matters, but there is a passage from the undergraduate textbook “The Earth System,” 3rd Ed. (Prentice Hall, 2010) by Lee Kump, James Kasting, and Robert Crane of the Earth System Science Center at Penn State which addresses this issue. In chapter 3, pages 48-49, they imply that it really is the dipole moment (they call it “separation of positive and negative electric charges within the molecule”) that matters to first order. As a parenthetical they say:
“Note that is a symmetric molecule because the three atoms are, on average, arranged in a line. However, the symmetry is broken when the molecule bends, allowing
  radiation to be absorbed or emitted.”
Incidentally, they also seem to suggest that for water, it is the rotation mode that matters most for the greenhouse effect. Apparently the rotation band of water vapor extends from around out to the microwave region. For completeness, the other greenhouse gases they mention are methane
  , nitrous oxide
  , ozone
  , freon-11
  , and freon-12
  .
.
Again, I hope this is helpful to the discussion.
Hi! I’m glad you posted a comment! And a very helpful one, too.
The remark about CO2 developing a dipole only when it bends makes a lot of sense: this suggests that CO2 is really bad at emitting or absorbing light when hopping between rotational modes, or even the vibrational modes that involve stretching rather than bending.
I didn’t know that rotational modes of H2O include frequencies in the infrared band, but this is not my field so I have little intuition for these things. I think a few back-of-the-envelope calculations could work wonders here, just to get a sense of what kinds of modes have what kinds of frequencies.
As for formatting, your only mistake was writing things like
$ latex N_2O$
The space between the dollar sign and the ‘latex’ is deadly; if you remove that things will work fine and you’ll get
I removed those spaces for you.
Personally I avoid math fonts for chemical compounds, because the letters in abbreviations for elements aren’t supposed to be italicized. So I’d use HTML for those and write
N<sub>2</sub>O
which gives
N2O
However, don’t worry about this kind of crud! I’m the son of an editor so I can’t help it… but what really matters is the science.
Tim van Beek says
…”Can a Cold Body Warm a Warmer Body?
Downward longwave radiation warms the surface, but the atmosphere is colder than the surface, so how can radiation from the colder atmosphere result in a higher surface temperature? Doesn’t that violate the second law of thermodynamics?”….
We need to be careful with semantics here.
“Warm” to most people means “heat”, yet anyone who has taken a course in thermodynamics knows heat is a special word.
The colloquial meaning and the thermodynamic meaning of HEAT quite often are not the same.
Tim’s article points out that the radiation from the atmosphere often called “backradiation” is better described as DLR.
The nighttime situation is simpler to understand and greenhouse effect advocates often cite, as the ultimate proof of the greenhouse effect.
The Earths surface radiates and otherwise heats the nighttime atmosphere.
No problems with using the word heat in this context, with the second law.
The nighttime atmosphere acts like a passive blanket restricting the flow of heat from the Earth surface.
This means that the Earths surface is warmer than it would be without the atmosphere.
Some are tempted therefor, to say that the atmosphere then, heats the Earth surface.
However inadvertently by a clumsy use of language they are implying a contradiction of the second law.
Quite right, however when you say…
…I’m tempted to add that the “clumsiness” lies in the eye of the beholder. One of the main obstacle of verbal communication is the insistence of the “correct way” of putting things, which is mostly an insistence that everybody has to use the domain specific language that you happen to be an expert in. This is especially dangerous in a very inderdisciplinary science like climate science.
I would like to ask every reader of this blog this question: Who is the bigger fool:
– the one who says that the colder atmosphere heats the warmer surface, inadvertently using the word “heat” not in the domain specific sense of thermodynamics,
– the one who insists that if you do that, this is a bullet-proof proof that you do not understand thermodynamics, even if this conclusion leads him into believing that thousands of climate scientists – including a lot of physicists – have misunderstood undergraduate thermodynamics for decades, and that an effect that can be and has been measured for decades cannot possibly exist?
Let’s try to talk about the Earth’s atmosphere, the greenhouse effect, and so on, rather than “who is the bigger fool”. As soon as one starts using words like “fool”, someone somewhere will become angry and lose their capacity for thinking clearly.
Tim van Beek says
Are using the word “heat” incorrectly.
It is true that thousands of climate scientists seem to have never taken an entry course in thermodynamics. One that includes, say, the Carnot Cycle. I would be very surprised if this included a “lot of physicists”.
Climate Science seems for years to have been cut off from communicating effectively with the rest of science.
The Greenhouse Theory that has nothing to do with greenhouses. Odd definitions of Infra Red Radiation is another example. Most climate scientists are surprised to find that the Solar Radiation contains nearly 50% IR.
Is this a good thing?
Who is being condescending when they say its alright for climate science to use inappropriate language when communicating with other scientists. I would assume that the viewers on the Azimuth site would have a high level of scientific literacy.
Scientific definitions like heat, work, energy, power, atomic number, mass, momentum etc should not have different meanings to different individuals. This leads to the type of confusion I pointed to above.
Another example this time away from thermodynamics. If a member of the public says to another “I think a whale is the biggest fish in the sea” we would all understand and probably let it pass without comment. But if I found the same comment in a biology textbook I would be shocked.
I think you will find this paper by Postma useful in this series.
Click to access Understanding_the_Atmosphere_Effect.pdf
Bryan wrote:
I would like to suggest that you say what statements of the paper you would like to discuss, but I have a boundary condition.
Postma writes, for example:
He then goes on to critizise that one should not claim that the ground surface is in equillibrium, but the whole earth.
My boundary condition is:
Let’s assume that we both know the two posts here on Azimuth, this one and its predecessor.
If we do, it is for example not necessary to point out that the temperature of a black body in Earth’s orbit in equillibrium is something different than the average temperature of the surface, however that is defined. Or that the Earth is not a perfect black body etc. At least I hope I succeded in explaining that I don’t believe in either statement.
And therefore I hope that we don’t have to discuss for example the statement that
and similar claims of Postma about what the “greenhouse theory” claims and why it violates basic physics.
An equivalent reformulation of my boundary condition is:
– “Let’s try to avoid “strawmen”
If you like to, you may pick a statement of Postma where there is a true disagreement of what he writes and of what I wrote.
For example, I would agree with:
Does Postma disagree or does he critizise the formulation
which I also – kind of – used? I’m not sure. The last formulation is misleading, so there is no true disagreement if he critizises this formulation only.
Tim van Beek
I have read your first post with interest.
I liked your twin peaks graph, correctly labelled and scaled.
The first post I understand was to set foundations for the rest of the series.
Including graphs that you can back refer to as the discussion develops.
Only one question from the first post, now that you have brought it up.
Among the consequences of a molecule absorbing a photon of any wavelength you have omitted a direct conversion into translational kinetic energy.
I have not come across this before.
I look forward to you developing your ideas as the series develops.
I thought that the Postma paper would be of some use to you.
It sets out a coherent outline of radiative physics and thermodynamics which explains the temperature profile of the Earth without reference to the greenhouse effect.
The main alternative greenhouse effect atmospheric model that is presented is a set of concentric layers radiating to one another.
Although I will admit there are different versions of the greenhouse effect that do not accept that approach.
I have no idea which way your series will develop, perhaps you will agree with much of what Postma says.
Bryan wrote:
Okay, thanks, I will look into it. There are certainly polemic statements in that paper that I don’t like, neither in style nor in content. But there are also scientific statements that I may comment on in the future.
Bryan wrote:
E.g. there is a tiny part about translational kinetic energy in these lecture notes
Do you know which exceptions?
(if I consider an average molecule at a temperature T=300 K, it will have an energy of about 25 meV. A photon with wavelength of 40 µm already embodies an amount of energy of the same order of magnitude. So their statement seems correct)
Btw, when a photon is absorbed and its energy is conversed to translational kinetic energy, what happens to its spin?
Frederik wrote:
If we look closely enough, we’ll see any photon absorbed by an atom or molecule is really absorbed by some electron or proton in that atom or molecule—usually an electron, in practice. Electrons and protons are both spin-1/2 particles, so they can have angular momentum +1/2 or -1/2 along any axis. When they absorb a photon, their angular momentum flips from +1/2 to -1/2, or vice versa.
Unfortunately I know elementary particle physics better than physical chemistry. While my description is right at the level of elementary particles, chemists probably talk about this stuff a bit differently, and they probably have good reasons for doing so.
But anyway: angular momentum is conserved, so the spin angular momentum of a photon is transferred to whatever absorbs it.
Are you sure about that?
Not that I know how this works, but I sure would like to.
I can imagine that spin 0 particles also get shaken by the electric fields of IR radiation, and they can’t change their spin angular momentum.
A 10 micron wavelength radiation wave looks locally to a molecule like a time dependent constant electric field, which doesn’t necessarily transfer angular momentum. These radiation waves are not eigenstates of the photon particle number operator, they do not have a definite particle number. (They are in a Glauber state) So when they transfer energy, do they have to transfer a definite photon, or do they go from one Glauber state to another, while changing a molecule from a vibrating one to a non vibrating?
Gerard
I can imagine that spin 0 particles also get shaken by the electric fields of IR radiation, and they can’t change their spin angular momentum.
In the amplitude for a spin-0 particle to absorb a photon, the change in four-momentum of the particle couples directly to the polarisation vector for the photon. So you could have a charged spin-0 particle in an eigenstate of orbital angular momentum around the z-axis in some coordinate system absorb a photon with a definite spin around the z-axis, and the spin-0 particle would increase or decrease its orbital angular momentum by one unit.
But in the amplitude for an electron to absorb a photon, the polarisation vector for the photon couples to the before and after spins of the electron. So a spin-down electron can absorb a photon and become spin-up, or vice versa.
As for whether or not the incident light is in an eigenstate for photon numbers and spins, whatever the incoming states of the light and the charged matter you can still write the overall amplitude by summing over these kinds of processes between these kinds of states.
I can imagine a vibrating CO2 molecule:
OCO
This does not seem to have a different angular momentum than a non-vibrating one. Also, you could excite this vibration by subjecting the molecule to a time dependent electric field aligned along the length axis of the molecule, as would exits in a radiation wave. So I can imagine infrared radiation exciting a molecule with no net angular momentum exchanged. Maybe this means 2 photons are exchanged? Perhaps a similar situation exists with phonons in a vibrating solid. These are ultimately held together by lots of photons, but it seems more or less irrelevant how exactly the photons do this: the phonon as a whole gets quantised and can exchange quanta (h f_phonon) with other phonons.
Gerard
I don’t know anything about the vibrational eigenstates of carbon dioxide molecules so I can’t say what kind of selection rules would apply to transitions between them, but on the face of it I can’t see why you couldn’t produce such a transition with the molecule absorbing a single infrared photon with a definite spin, and either an electron or a proton in the molecule undergoing a change of spin.
The fact that there’s no change in angular momentum associated with the transition between vibrational eigenstates is beside the point: it’s the change in spin of an individual fermion that accounts for the spin of the absorbed photon, at least in the first instance.
No one’s insisting that there’s a net transfer of angular momentum in every complicated interaction between matter and radiation. The original question, though, was about a single photon of definite spin being absorbed — in which case the photon’s angular momentum is balanced by a fermion undergoing a spin flip.
Greg Egan wrote:
So if we have a molecule with fully filled electron orbitals, it would be impossible to absorb a single photon without being accompanied by an electronic transition?
(I’m neglecting the nucleus here, I suppose the chance of finding a molecule with fully filled electron and nuclear orbitals is almost zero)
Frederik De Roo wrote:
That does sound like a logical conclusion to me — but I don’t understand all the subtleties of molecular transitions, so there might actually be some way around the Pauli exclusion principle there.
Actually … electron transitions where the orbital quantum number l remains unchanged are generally forbidden by selection rules (because the matrix element of the electric dipole between the initial and final states is zero), so the angular momentum of an absorbed photon would usually end up changing the orbital angular momentum of the electron, and leaving its spin unchanged.
Also, according to the notes that Frederik linked to, selection rules favour vibrational transitions that are accompanied by a one-quantum rotational transition, presumably for similar reasons. So again, it won’t actually be a fermion spin-flip that ends up accounting for the angular momentum of the absorbed photon.
Ultimately this must be reconcilable with the QED description of the electron-photon interaction, where the electron does change its spin. That description involves electrons in momentum eigenstates, so maybe everything sorts itself out when you integrate over an actual wave function for an atomic orbital. Or maybe there’s something more complicated going on.
If you like to (anyone participating in this discussion), there is the opportunity to preserve the knowledge of this discussion on the Wiki page molecular emission spectrum. I plan to add to it, but so far all I have learned and realized is how much I have forgotten about molecular quantum physics during the last decade :-(
Thanks Frederik.
My understanding up till recently was that very long wavelengths(>40um) could be directly absorbed and the energy transferred to translational KE.
As your notes say this mode is not quantised.
I have also seen the same point expressed in another way which says it is quantised but the levels overlap and are so numerous that effectively it is not quantised.
On the spin my vague memory says it is undefined on absorption or alternatively the angular momentum is shared with the universe.
Perhaps there is some new information as both these suggestions seem like a cop out
I also calculated the earth temperature based on black body radiation, and I included the atmosphere as a radiation source/sink. With zero atmosphere, I got -19 Celsius, which is indeed about 33K lower than the 14 Celsius which is roughly the temperature averaged over time and the earth surface.
Interesting to compare to the temperature of the moon, which has no atmosphere. According to Wikipedia, the moon the surface temperature averages 107 °C, and during the lunar night, it averages −153 °C. The average of that is -23’C, pretty close to -19’C.
The extra 33K comes from the greenhouse effect.
here are the details of my calculation.
Gerard
Hello! Could anyone here recommend a one-dimensional energy balance model which can catch seasons? I’ve started learning a new program language (http://www.aldor.org/) and want to implement a 1D EBM as a learning task.
The model should be physically pure, that is it should not be simplified to ease computer implementation. And again, I wish the model to reproduce seasons.
Maybe it is not the best place to ask the question, in that case pleases just move it elsewhere.
Sorry, I missed your post here…
The best source for energy balance models with concrete implementations that I know is
• Kendal McGuffie and Ann Henderson-Sellers, A Climate Modelling Primer, 3rd edition, Wiley, New York, 2005.
Here you’ll find implementations in different programming languages that you could adapt. It should be easy enough to introduce a temporal dependence of the solar constant to get season-like behaviour.
Do you mean by the solar constant the one that depends on the latitude? Otherwise it would be only “season-like”, it won’t reproduce the major fact about seasons — seasons depend on the latitude. Equator has no seasons, northern and southern hemispheres have opposite ones. It would be really cool for a 1D model, being much simpler compared to general circulation models, to resolve such stuff.
As for A Climate Modelling Primer, it’s a nice book, but as far as I understand its 1D EBM dates back to ~1983. Just thought there was something more recent, using modern (bulky) data and free of any computation efficiency concerns.
The basic idea of an energy balance model hasn’t changed much over the years, so AFAIK the 1983 model is still – as a model – up to date.
Sorry, I am not sure to what data you refer, the input data of an EBM are some simple constants resp. step functions. Efficiency concerns are of no importance here, of course, you can program the EBM with whatever language on whatever laptop or desktop computer you want.
Yes, sorry, more precisely: In the 1D model you have the “mean annual radiation incident at a certain latitude” as forcing function. I think you could replace this e.g. by the mean monthly radiation as a function of both latitude and month. I.e. you’d introduce a new time variable denoting the month of the year.
Tim, I think the omission from those models is significant, leaving out the demand equation for the (economic) environment they are intended to be models for. The earth doesn’t have ever multiplying resource and energy throughput demand, no, but the economies most certainly do.
They’re guided by rules for maximizing the rate of monetary growth. That’s done using innovation to make the value of resource consumption greater and greater. One effect is to cause resource consumption to always multiply too, though at a marginally slower exponential rate than GDP.
Omitting that from the models is very highly consequential for the quality of the guidance the otherwise high quality climate models offer.
Enjoyed the post, thanks!
Question though…and I can’t seem to find this information anywhere…what does the spectrum of the oceans look like? Since it strongly absorbs sunlight except near the blue part of the spectrum, won’t its spectrum be different that that of land (and deviate from the simple blackbody model)? And how will this difference affect the greenhouse gases above land and sea, respectively?
Glad you like the post :-)
I’ll try to address your questions to the extend that I am able, but would be really interested in the opinion of an expert.
Oceanographers model the emission of the surface of the oceans as black body radiation. Unfortunately I don’t have any good reference for this, but if I find one I’ll come back.
I think that a pure water planet would have a different overall albedo, but besides that assuming that the surface reacts roughly like a black body would still be a valid assumption.
Of course the oceans have a much higher heat capacity than everything else on Earth, so that the heat stored and transported by the oceans plays a major role in the overall heat transfer of the planet. But that is an aspect that we abstracted away in the 0D energy balance model, so that would stay the same for a water planet.
I assume you talk about water wapor? Other greenhouse gases are not influenced by the presence of oceans or land mass…
And now an interesting puzzle, I hope you all will like it. In New Scientist, March 3, 1966 Daedalus claimed that the radiation temperature of the sky at night is about absolute zero. So he suggested to use it as a heat sink for a heat engine.
Later in his book “The Inventions of Daedalus: A Compendium of Plausible Schemes” he mentioned a group from Naples university who managed to create plates, which were transparent for visible light, but opaque in the range of the infrared window. These plates were ten degrees centigrade cooler than ambient air during both night and day. That was around 1978.
So the question — is it possible to cool a thing down to 4 K just by emitting its heat into space, without any additional work?
A calculation shows that 300 K black body surface will emit ~ 460 W/m2. Can we somehow use this heat sink to produce energy?
Unfortunately I could not find that New Scientist issue — surprisingly Google books has all the issues except the ones between 1965 and 1970. Neither I have the English version of the book, only the Russian translation.
A very nice puzzle! Instead of trying to answer it, I’ll mention a somewhat related one: “Can you see stars in the day from the bottom of a well?”
There’s a widespread belief that you can. And if you can, that suggests (by reciprocity) that you can send infrared radiation directly into space, without it getting absorbed by the intervening atmosphere.
This related puzzle is discussed here. The answer seems to be no.
But of course you can see stars at night. So I think the answer to your puzzle depends on whether it’s day or night.
Argh, the papers are behind paywalls.
Somehow I suspect that this is not as easy as it may look…
I’m not sure what the definition of “radiation temperature” is, but the clear night sky in Antartica sends about 80 Watts per square meter to the surface (DLR = downward longwave radiation = greenhouse effect), so it is not completely black.
See:
• Michael S. Town, P. Walden, and Stephen G. Warren, Spectral and broadband longwave downwelling radiative fluxes, cloud radiative forcing, and fractional cloud cover over the south pole (online here).
I think that is close to the global minimum of DLR.
Seems to be plausible.
How could we insulate it from its surroundings here on Earth?
But as a thought experiment: If you put it in a box in a vacuum, with the box shielding it from any kind of radiation from below and from the sides, why wouldn’t that work (at night)?
Does someone have the energy (no pun intended) to work out the temperature of a blackbody that emits 80 watts per square meter? That would give a rough approximate answer for ‘the temperature of the night sky’.
I imagine it’s considerably warmer than 4 K. I have no idea why Daedalus (whoever that is) claimed the ‘temperature of the night sky’ (whatever that means) is about absolute zero.
I think this blackbody temperature would quite well approximate the melting point of carbon dioxide (no pun intended), which is 195 K at atmospheric pressure.
Sorry, I didn’t see Greg Egan’s result yet. But it’s good that I have the same result, as the calculation involved some tedious math ;-)
If both you trustworthy guys say the temperature is 194-195 K, I can bet my life on that. Thanks!
I get 194 K, or about -79 C. It wouldn’t surprise me if you could cool something almost to that point by leaving it out on a clear Antarctic night.
Yes, I think that the insulating from the surroundings is the biggest problem. Those 80 Watts per square meter are mostly not in the infrared window, are they? So if we had some magic material that reflects everything out of the infrared window (but is black within it), it would receive much less than 80 Watts from the sky.
Yes, that’s right: If you browse the paper that I mentioned above you’ll find a calculated (figure 2) and a measured spectrum of DLR (figure 5) which shows the atmospheric window with a small peak in it denoting the contribution of Ozone, which I have left out in the main blog post. But left and right of that peak there are frequencies with almost zero radiation.
So a material that reacts to these frequencies only and is perfectly isolated should be able to cool down to a couple of Kelvins via IR emission. But I think the emitted radiation flux should decrease rapidly with lower temperatures which would slow the cooling process; it should be possible to determine the kind of function (temperature as function of time) to expect.
I used to study this stuff for my diploma exam in experimental solid state physics, but that was a decade ago.
I had the same thoughts so I’ve just conducted the computations to determine the equilibrium temperature of a 1 m^2 plate allowed to emit radiation between 5.5 and 7.5 μm, the plate being also supplied by an energy input of X Watts. That X is meant to represent the insufficient insulation of the plate or that ozon contribution. The table:
X, W T, K
10 252
1 199
0.1 163
0.01 138
0.001 120
1e-6 85
The equation for T: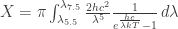
So the answer is no, you can’t cool a thing down to several Kelvins only relying on the radiant cooling (unless you can provide insulation that lets through no more than 10^{-100} Watts). Maybe that last number is wrong, but it should be some really small quantaty.
Well, one can use the heat sink to produce energy to power a conventional freezer, but it wasn’t meant by the puzzle.
I’ve found the work mentioned by D. Jones:
http://www.sciencedirect.com/science/article/pii/0306261977900150
“Radiative cooling of surfaces exposed to a clear sky can be used as an energy source: we have already shown in a previous paper that useful temperatures and powers can be reached using selective surfaces matched to the atmospheric transparency window.
Here we present some measurements of the radiative power of a new selective surface and an example of a possible practical application.”
Google Scholar gives later articles, citing this work:
http://scholar.google.com/scholar?cites=13151594497347986356&as_sdt=2005&sciodt=0,5&hl=en
It’s a problem, at least in some areas:
http://www.google.com/search?q=cool+roof+condensation
from this site, a brief excerpt:
http://www.aecb.net/forum/index.php?topic=921.0
—-
“Reliable Control of Interstitial Condensation in Lightweight Roof Systems” is may be of interest.)
http://www.kuleuven.ac.be/bwf/common/data/PhD_1998_Janssens.pdf
Another study examining Zinc roofs was also undertaken:
An evaluation of highly insulated cold zinc roofs in a moderate humid region—part I: hygrothermal performance, Construction and Building Materials. R. Zheng, A. Janssens, J. Carmeliet , W. Bogaerts , H. Hens, 2004
The “discovery” was that with out a perfect air-vapour barrier moisture problems abound! …
—-
The same kind of structure is being used for removing humidity from Florida living spaces — condense it under the cool roof overnight then use exhaust fans during the day to move the moisture out while the outside air is warmer and slightly drier.
It’s not obvious how changes in the eccentricity of the Earth’s orbit affect the total amount of sunlight it gets each year. Luckily, Greg Egan has done the work for us. […]
There is a small flaw in this post, due to different definitions of Near Infrared, e.g. between Remote Sensing and Astronomy. The Earth does not radiate (significantly) in the Near Infrared in the Remote Sensing definition, but in this definition NIR is not up to 5 microns! It can be observed from the twin peak graph that the Earth does radiate (a little bit, but still significantly) below 5 microns.
Hello!
A very good introduction on climate modeling and simulation is Raymond Pierrehumbert’s book Principles of Planetary Climate from Cambridge Press.
I like his “hands on” philosophy: for example, there are many very interesting numerical projects in Python to give the intuitive feeling about this part of physics.
http://geosci.uchicago.edu/~rtp1/PrinciplesPlanetaryClimate/index.html
Thanks! It would be great if you could add it to our list of Recommended Reading over on the Azimuth Project! We’ve already got a few books on climate modelling in that list.
[…] Tim van Beek, A quantum of warmth, […]
As you can see, the all-important absorption of infrared radiation by water vapor and carbon dioxide is quite complicated. You need quantum mechanics to predict how this works from first principles. Tim van Beek gave a gentle introduction to some of the key ideas here:
• Tim van Beek, A quantum of warmth, Azimuth, 2 July 2011.
We need to do some math to figure out the net effect of a change in the eccentricity of the Earth’s orbit. Luckily, Greg Egan did this calculation in a very nice way, earlier here on the Azimuth blog. I’ll show you his calculation at the end of this article […]