My title here is the eye-catching—but exaggerated!—-title of this well-known paper:
• John P. A. Ioannidis, Why most published research findings are false, PLoS Medicine 2 (2005), e124.
It’s open-access, so go ahead and read it! Here is his bold claim:
Published research findings are sometimes refuted by subsequent evidence, with ensuing confusion and disappointment. Refutation and controversy is seen across the range of research designs, from clinical trials and traditional epidemiological studies to the most modern molecular research. There is increasing concern that in modern research, false findings may be the majority or even the vast majority of published research claims. However, this should not be surprising. It can be proven that most claimed research findings are false. Here I will examine the key factors that influence this problem and some corollaries thereof.
He’s not really talking about all ‘research findings’, just research that uses the
ill-founded strategy of claiming conclusive research findings solely on the basis of a single study assessed by formal statistical significance, typically for a p-value less than 0.05.
His main interests are medicine and biology, but many of the problems he discusses are more general.
His paper is a bit technical—but luckily, one of the main points was nicely explained in the comic strip xkcd:
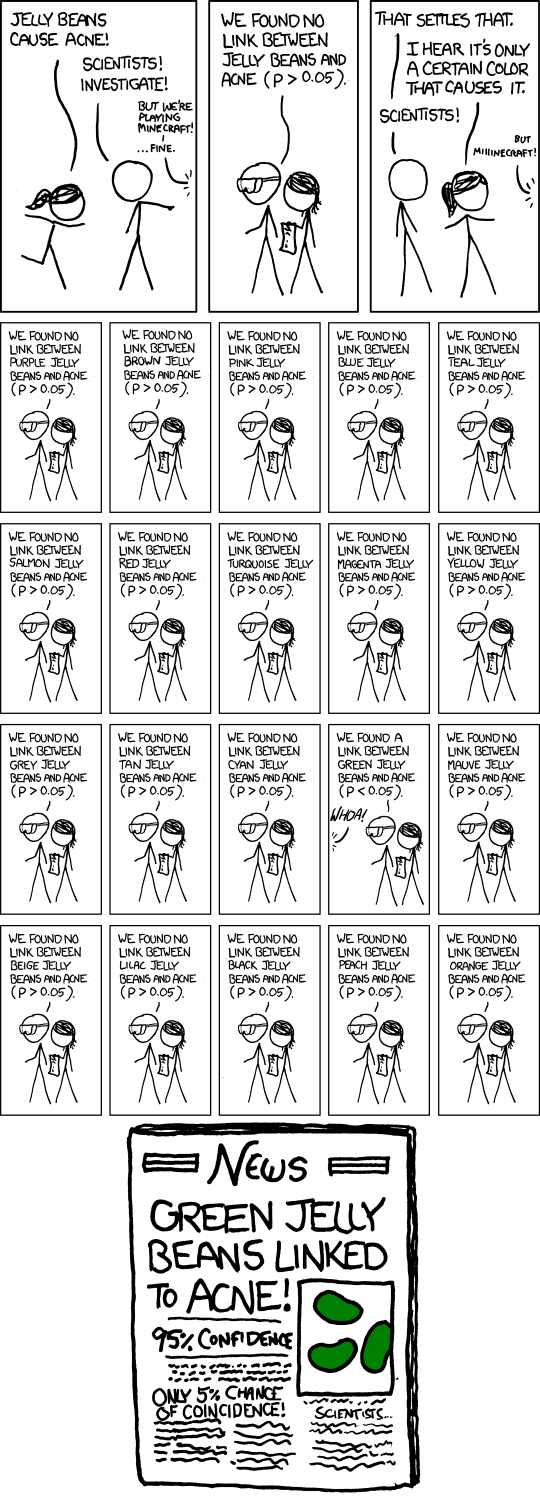
If you try 20 or more things, you should not be surprised that once an event with probability less than 0.05 = 1/20 will happen! It’s nothing to write home about… and nothing to write a scientific paper about.
Even researchers who don’t make this mistake deliberately can do it accidentally. Ioannidis draws several conclusions, which he calls corollaries:
• Corollary 1: The smaller the studies, the less likely the research findings are to be true. (If you test just a few jelly beans to see which ones ‘cause acne’, you can easily fool yourself.)
• Corollary 2: The smaller the effects being measured, the less likely the research findings are to be true. (If you’re studying whether jelly beans cause just a tiny bit of acne, you you can easily fool yourself.)
• Corollary 3: The more quantities there are to find relationships between, the less likely the research findings are to be true. (If you’re studying whether hundreds of colors of jelly beans cause hundreds of different diseases, you can easily fool yourself.)
• Corollary 4: The greater the flexibility in designing studies, the less likely the research findings are to be true. (If you use lots and lots of different tricks to see if different colors of jelly beans ‘cause acne’, you can easily fool yourself.)
• Corollary 5: The more financial and other interests and prejudices in a scientific field, the less likely the research findings are to be true. (If there’s huge money to be made selling acne-preventing jelly beans to teenagers, you can easily fool yourself.)
• Corollary 6: The hotter a scientific field, and the more scientific teams involved, the less likely the research findings are to be true. (If lots of scientists are eagerly doing experiments to find colors of jelly beans that prevent acne, it’s easy for someone to fool themselves… and everyone else.)
Ioannidis states his corollaries in more detail; I’ve simplified them to make them easy to understand, but if you care about this stuff, you should read what he actually says!
The Open Science Framework
Since his paper came out—and many others on this general theme—people have gotten more serious about improving the quality of statistical studies. One effort is the Open Science Framework.
Here’s what their website says:
The Open Science Framework (OSF) is part network of research materials, part version control system, and part collaboration software. The purpose of the software is to support the scientist’s workflow and help increase the alignment between scientific values and scientific practices.
• Document and archive studies.
Move the organization and management of study materials from the desktop into the cloud. Labs can organize, share, and archive study materials among team members. Web-based project management reduces the likelihood of losing study materials due to computer malfunction, changing personnel, or just forgetting where you put the damn thing.
• Share and find materials.
With a click, make study materials public so that other researchers can find, use and cite them. Find materials by other researchers to avoid reinventing something that already exists.
• Detail individual contribution.
Assign citable, contributor credit to any research material – tools, analysis scripts, methods, measures, data.
• Increase transparency.
Make as much of the scientific workflow public as desired – as it is developed or after publication of reports. Find public projects here.
• Registration.
Registering materials can certify what was done in advance of data analysis, or confirm the exact state of the project at important points of the lifecycle such as manuscript submission or at the onset of data collection. Discover public registrations here.
• Manage scientific workflow.
A structured, flexible system can provide efficiency gain to workflow and clarity to project objectives, as pictured.
CONSORT
Another group trying to improve the quality of scientific research is CONSORT, which stands for Consolidated Standards of Reporting Trials. This is mainly aimed at medicine, but it’s more broadly applicable.
The key here is the “CONSORT Statement”, a 25-point checklist saying what you should have in any paper about a randomized controlled trial, and a flow chart saying a bit about how the experiment should work.
What else?
What are the biggest other efforts that are being made to improve the quality of scientific research?


One can’t help thinking of Peter Medawar’s question, “ Is The Scientific Paper A Fraud?”.
[…] Professor John Carlos Baez tipped and explained John Ioannidis’ famous 2005 paper “Why Most Published Research […]
How does the reasoning in the IPCC reports, and the studies they’re based on, stand up to the kind of scrutiny Ioannidis suggests?
That’s a huge question, since the IPCC reports are thousands of pages long and rely on vast numbers of different studies, and often a meta-analysis of these studies. I bet you’ll only get ideologically motivated answers if you pose the question at such a broad level: some people are motivated to attack the IPCC, and others to defend it. To get more interesting replies it’s probably better to focus on a more specific aspect of the IPCC reports.
Eye-opening, thanks very much! Among other things I now have more insight into the ever changing stream of nutritional and medical guidelines coming at me from all directions.
1) what is the “odds ratio” mentioned in Box 1 of the paper?
2) apologies for my ignorance, but how often is it possible to meaningfully estimate β and R? I suspect R is typically the sticky one. But even a rough and partly subjective PPV value would seem a valuable corrective to producers (and very valuable caveat to consumers) of these studies.
3) Even *I* realize that per-study estimation of u is a fools’ errand; but in cases where the bias-free PPV *is* meaningfully estimable, a journal could require that PPV be reported assuming each of a spread of plausible u-values e.g. {0,.05,0.1,0.2}
I don’t have much to say about question 2); maybe a statistician around here could tackle that one!
As for question 1), here’s what Wikipedia says about the ‘odds ratio’:
Thank you John (I’d assumed this term too generic for Wikipedia, but I was mistaken).
Reproducibility is a big deal in computational mathematics, both pure and applied. Last December I participated in a workshop at ICERM on this topic. You can read the final report, which is certainly an “effort to improve the quality of scientific research”, here: http://icerm.brown.edu/html/programs/topical/tw12_5_rcem/icerm_report.pdf
That looks good! Let me quote some, since most people will be too busy to click the link:
Yes this does look good, but people have been saying things like this for a long time without much changing.
This article Lost Branches on the Tree of Life
http://www.plosbiology.org/article/info%3Adoi%2F10.1371%2Fjournal.pbio.1001636
documents the sad state of affairs in my area. For example, BEAST is a very popular program for phylogenetic analysis. The user must supply an xml file as input, and that file can be included in supplementary material when publishing. But
“Our survey of publications that implemented BEAST revealed that only 11 out of 100 (11%) examined studies provided access to the underlying xml input file, which is critical for reproducing BEAST results.”
and
“Failure on a Massive Scale
“Our findings indicate that while some journals (e.g., Evolution, Nature, PLOS Biology, Systematic Biology) currently require nucleotide sequence alignments, associated tree files, and other relevant data to be deposited in public repositories, most journals do not have these requirements; resultantly, the systematics community is doing a poor job of making the actual datasets available. More troublesome perhaps is that the situation has barely improved over the 12 years covered in this study (Figures 1 and 2). In addition, when data are deposited, they often do not include critical information such as what was actually included in data alignments (e.g., what characters were excluded, full taxon names; see Table S1 and Figure S1). Without accurate details describing how alignments were implemented, it is difficult or perhaps impossible to faithfully reproduce the study results. Additionally, parameters for the program BEAST are rarely made available for scrutiny. Lastly, in many cases when data were not deposited to TreeBASE, the authors indicated that the data could be obtained directly from them; however, our survey indicates this is typically not the case (only ~40% of authors even respond, and of these only a small percent actually provide the requested data)—hence, many alignments and analysis parameters seem to be lost forever.”
related:
http://www.jstor.org/stable/2138833
[…] John Baez does a nice job of simplifying the corollaries, and there is some good discussion to follow it on his blog. […]
This article showing lack of rigour in open access journals gives further cause for alarm http://www.sciencemag.org/content/342/6154/60.full
Yes, but note that this study in Science did not compare open access journals to other journals—like, umm, Science.
This is bad, because if there are problems with all journals, or most journals, the study will make these seem like problems with open access journals! By analogy, consider a study of black American men who beat their wives, that does not bother to compare the behavior of white men. Would that be wise?
There’s a more detailed critique here:
• Mike Taylor, Anti-tutorial: how to design and execute a really bad study, Sauropod Vertebra Picture of the Week, 7 October 2013.
Quoting:
The link is to another critique:
• Gunther Eysenbach, Unscientific spoof paper accepted by 157 “black sheep” open access journals – but the Bohannon study has severe flaws itself, 5 October 2013.
Clearly we need bloggers to keep an on the supposedly serious researchers who publish in Science.