This story caught my attention, since a lot of people are passing it around:
• Nafeez Ahmed, NASA-funded study: industrial civilisation headed for ‘irreversible collapse’?, Earth Insight, blog on The Guardian, 14 March 2014.
Sounds dramatic! But notice the question mark in the title. The article says that “global industrial civilisation could collapse in coming decades due to unsustainable resource exploitation and increasingly unequal wealth distribution.” But with the word “could” in there, who could possibly argue? It’s certainly possible. What’s the actual news here?
It’s about a new paper that’s been accepted the Elsevier journal Ecological Economics. Since this paper has not been published, and I don’t even know the title, it’s hard to get details yet. According to Nafeez Ahmed,
The research project is based on a new cross-disciplinary ‘Human And Nature DYnamical’ (HANDY) model, led by applied mathematician Safa Motesharrei of the US National Science Foundation-supported National Socio-Environmental Synthesis Center, in association with a team of natural and social scientists.
So I went to Safa Motesharrei‘s webpage. It says he’s a grad student getting his PhD at the Socio-Environmental Synthesis Center, working with a team of people including:
• Eugenia Kalnay (atmospheric science)
• James Yorke (mathematics)
• Matthias Ruth (public policy)
• Victor Yakovenko (econophysics)
• Klaus Hubacek (geography)
• Ning Zeng (meteorology)
• Fernando Miralles-Wilhelm (hydrology).
I was able to find this paper draft:
• Safa Motesharri, Jorge Rivas and Eugenia Kalnay, A minimal model for human and nature interaction, 13 November 2012.
I’m not sure how this is related to the paper discussed by Nafeez Ahmed, but it includes some (though not all) of the passages quoted by him, and it describes the HANDY model. It’s an extremely simple model, so I’ll explain it to you.
But first let me quote a bit more of the Guardian article, so you can see why it’s attracting attention:
By investigating the human-nature dynamics of these past cases of collapse, the project identifies the most salient interrelated factors which explain civilisational decline, and which may help determine the risk of collapse today: namely, Population, Climate, Water, Agriculture, and Energy.
These factors can lead to collapse when they converge to generate two crucial social features: “the stretching of resources due to the strain placed on the ecological carrying capacity”; and “the economic stratification of society into Elites [rich] and Masses (or “Commoners”) [poor]” These social phenomena have played “a central role in the character or in the process of the collapse,” in all such cases over “the last five thousand years.”
Currently, high levels of economic stratification are linked directly to overconsumption of resources, with “Elites” based largely in industrialised countries responsible for both:
“… accumulated surplus is not evenly distributed throughout society, but rather has been controlled by an elite. The mass of the population, while producing the wealth, is only allocated a small portion of it by elites, usually at or just above subsistence levels.”
The study challenges those who argue that technology will resolve these challenges by increasing efficiency:
“Technological change can raise the efficiency of resource use, but it also tends to raise both per capita resource consumption and the scale of resource extraction, so that, absent policy effects, the increases in consumption often compensate for the increased efficiency of resource use.”
Productivity increases in agriculture and industry over the last two centuries has come from “increased (rather than decreased) resource throughput,” despite dramatic efficiency gains over the same period.
Modelling a range of different scenarios, Motesharri and his colleagues conclude that under conditions “closely reflecting the reality of the world today… we find that collapse is difficult to avoid.” In the first of these scenarios, civilisation:
“…. appears to be on a sustainable path for quite a long time, but even using an optimal depletion rate and starting with a very small number of Elites, the Elites eventually consume too much, resulting in a famine among Commoners that eventually causes the collapse of society. It is important to note that this Type-L collapse is due to an inequality-induced famine that causes a loss of workers, rather than a collapse of Nature.”
Another scenario focuses on the role of continued resource exploitation, finding that “with a larger depletion rate, the decline of the Commoners occurs faster, while the Elites are still thriving, but eventually the Commoners collapse completely, followed by the Elites.”
In both scenarios, Elite wealth monopolies mean that they are buffered from the most “detrimental effects of the environmental collapse until much later than the Commoners”, allowing them to “continue ‘business as usual’ despite the impending catastrophe.” The same mechanism, they argue, could explain how “historical collapses were allowed to occur by elites who appear to be oblivious to the catastrophic trajectory (most clearly apparent in the Roman and Mayan cases).”
Applying this lesson to our contemporary predicament, the study warns that:
“While some members of society might raise the alarm that the system is moving towards an impending collapse and therefore advocate structural changes to society in order to avoid it, Elites and their supporters, who opposed making these changes, could point to the long sustainable trajectory ‘so far’ in support of doing nothing.”
However, the scientists point out that the worst-case scenarios are by no means inevitable, and suggest that appropriate policy and structural changes could avoid collapse, if not pave the way toward a more stable civilisation.
The two key solutions are to reduce economic inequality so as to ensure fairer distribution of resources, and to dramatically reduce resource consumption by relying on less intensive renewable resources and reducing population growth:
“Collapse can be avoided and population can reach equilibrium if the per capita rate of depletion of nature is reduced to a sustainable level, and if resources are distributed in a reasonably equitable fashion.”
The HANDY model
So what’s the model?
It’s 4 ordinary differential equations:


where:
• 
• 
• 
• 
The authors say that
Natural resources exist in three forms: nonrenewable stocks (fossil fuels, mineral deposits, etc), renewable stocks (forests, soils, aquifers), and flows (wind, solar radiation, rivers). In future versions of HANDY, we plan to disaggregate Nature into these three different forms, but for simplication in this version, we have adopted a single formulation intended to represent an amalgamation of the three forms.
So, it’s possible that the paper to be published in Ecological Economics treats natural resources using three variables instead of just one.
Now let’s look at the equations one by one:
This looks weird at first, but 


Similarly, in


For both the elite and commoners, the death rate drops linearly with increasing wealth from its maximum value 


Next, how do natural resources change?
The first part of this equation:

describes how natural resources renew themselves if left alone. This is just the logistic equation, famous in models of population growth. Here 


But the whole equation
has a term saying that natural resources get used up at a rate proportional to the population of commoners 

It’s curious that the population of elites doesn’t affect the depletion of natural resources, and also that doubling the amount of natural resources doubles the rate at which they get used up. Regarding the first issue, the authors offer this explanation:
The depletion term includes a rate of depletion per worker,
and is proportional to both Nature and the number of workers. However, the economic activity of Elites is modeled to represent executive, management, and supervisory functions, but not engagement in the direct extraction of resources, which is done by Commoners. Thus, only Commoners produce.
I didn’t notice a discussion of the second issue.
Finally, the change in the amount of wealth is described by this equation:
The first term at right precisely matches the depletion of natural resources in the previous equation, but with the opposite sign: natural resources are getting turned into ‘wealth’. 

For both the elite and commoners, consumption grows linearly with increasing wealth until wealth reaches the critical level 
So, that’s the model… at least in this preliminary version of the paper.
Some solutions of the model
There are many parameters in this model, and many different things can happen depending on their values and the initial conditions. The paper investigates many different scenarios. I don’t have the energy to describe them all, so I urge you to skim it and look at the graphs.
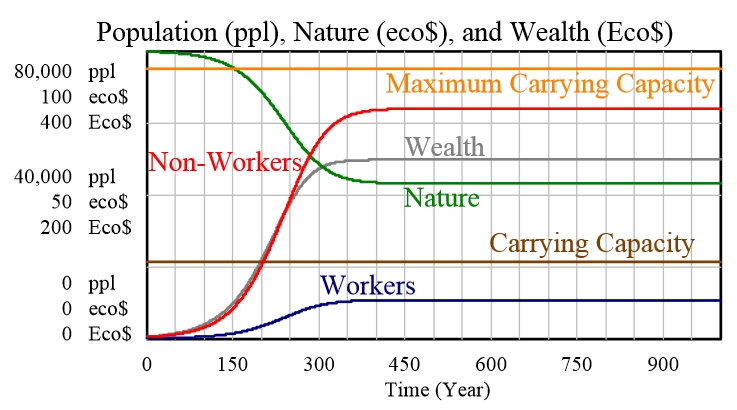
I’ll just show you three. Here is one that Nafeez Ahmed mentioned, where civilization
appears to be on a sustainable path for quite a long time, but even using an optimal depletion rate and starting with a very small number of Elites, the Elites eventually consume too much, resulting in a famine among Commoners that eventually causes the collapse of society.

I can see why Ahmed would like to talk about this scenario: he’s written a book called A User’s Guide to the Crisis of Civilization and How to Save It. Clearly it’s worth putting some thought into risks of this sort. But how likely is this particular scenario compared to others? For that we’d need to think hard about how well this model matches reality.
It’s obviously a crude simplification of an immensely complex and unknowable system: the whole civilization on this planet. That doesn’t mean it’s fundamentally wrong! Its predictions could still be qualitatively correct. But to gain confidence in this, we’d need material that is not made in the draft paper I’ve seen. It says:
The scenarios most closely reflecting the reality of our world today are found in the third group of experiments (see section 5.3), where we introduced economic stratication. Under such conditions,
we find that collapse is difficult to avoid.
But it would be nice to see a more careful approach to setting model parameters, justifying the simplifications built into the model, exploring what changes when some simplifications are reduced, and so on.
Here’s a happier scenario, where the parameters are chosen differently:
The main difference is that the depletion of resources per commoner,
And here’s yet another, featuring cycles of prosperity, overshoot and collapse:

Tentative conclusions
I hope you see that I’m neither trying to ‘shoot down’ this model nor defend it. I’m just trying to understand it.
I think it’s very important—and fun—to play around with models like this, keep refining them, comparing them against each other, and using them as tools to help our thinking. But I’m not very happy that Nafeez Ahmed called this piece of work a “highly credible wake-up call” without giving us any details about what was actually done.
I don’t expect blog articles on the Guardian to feature differential equations! But it would be great if journalists who wrote about new scientific results would provide a link to the actual work, so people who want to could dig deeper can do so. Don’t make us scour the internet looking for clues.
And scientists: if your results are potentially important, let everyone actually see them! If you think civilization could be heading for collapse, burying your evidence and your recommendations for avoiding this calamity in a closed-access Elsevier journal is not the optimal strategy to deal with the problem.
There’s been a whole side-battle over whether NASA actually funded this study:
• Keith Kloor, About that popular Guardian story on the collapse of industrial civilization, Collide-A-Scape, blog on Discover, March 21, 2014.
• Nafeez Ahmed, Did NASA fund ‘civilisation collapse’ study, or not?, Earth Insight, blog on The Guardian, 21 March 2014.
But that’s very boring compared to fun of thinking about the model used in this study… and the challenging, difficult business of trying to think clearly about the risks of civilizational collapse.
Addendum
The paper is now freely available here:
• Safa Motesharri, Jorge Rivas and Eugenia Kalnay, Human and nature dynamics (HANDY): modeling inequality and use of resources in the collapse or sustainability of societies, Ecological Economics 101 (2014), 90–102.


Many thanks for your observations on this paper that I’d seen references to on my Twitter feed but hadn’t looked into. From a Humanities perspective, I’d venture that the most outstanding aspect of this research is the ‘flat’ definition of ‘elite’ and ‘commoner’ as functions of how much wealth you have. It’s a bit more complicated than that, surely? I mean, this makes it easy to do the math, but it doesn’t mean that the results will reflect likely future scenarios if the defined functions don’t reflect the complex nature of human variables. ‘Elite’ could be defined on the basis of intelligence, for instance, and I wouldn’t be surprised if there was some correlation between birth rate, death rate and intelligence that threw these equations out. Elites in one society might not have the same demographic profile (or even the same factor of wealth) as elites in another society. If you’re talking ‘rich’ and ‘poor’, then say so. Otherwise, detail why you use other terms.
It may seem, in the context of the research, that these questions are rather trivial and don’t affect the overall finding. Nevertheless, I think they need to be considered. Apart from anything else, the unquestioning acceptance of a correlation between ‘elite’ and wealth has some ideological undertones: ‘elite’ is not a neutral word. Nor is ‘commoner’. There’s something slightly repellent about the idea that we think of ‘the masses’ in one category (the swarming workers, mindlessly following orders, or some such) and the pampered few on the other, (dithering between choosing a Chateau Cheval Blanc ’47 or a Krug ’28 to go with the caviar). Perhaps this unquestioning acceptance is inevitable: after all, there have always been, and no doubt will always be, inequalities. But how you tell the story changes the story: the gap between ‘rich’ and ‘poor’ is increasing and this has implications for the very effect this research is addressing. More poignantly, we have to watch ourselves in using language: commoners are not lesser beings, yet that’s what ‘elite’ implies. I think it was Stephen Jay Gould, when asked what he had to say about Einstein’s intelligence, who replied to the effect that, it wasn’t the extraordinary genius of Einstein that he pondered over particularly, but the countless number of his equivalent in intelligence who had starved and suffered in prisons and ghettos without ever getting an opportunity to explore their potential for brilliance.
Many thanks again for your provocative work.
Kind thoughts,
Lucy
Thanks for your comments, Lucy!
When it comes to modelling the whole of human society, every model is bound to be oversimplified. It’s always “a bit more complicated than that”.
So, it’s very easy to find ways in which this model or any model is oversimplified. The hard part is to find which oversimplifications can be easily corrected to make a model that’s significantly better.
My main proposal is this: don’t assume that doubling the amount of natural resources on the planet will automatically double the amount of consumption even when the population is fixed… or that halving it will halve the amount of consumption. Instead of linear proportionality, how about simply saying the rate of resource consumption is independent of the amount of resources as long as any resources are left—e.g., people chop down trees until they’re all gone. This is oversimplified too—it’s harder to catch fish when there are fewer left in the sea. But a more complicated dependency would introduce at least one extra parameter, so how about keeping it simple and seeing if it significantly increases the risk of a ‘hard collapse’. (It seems perhaps people on Easter Island did cut down trees until they were all gone.)
How could we easily improve the model’s treatment of social stratification?
maybe apply the simulation Sugarscape.
it also shows this split.
http://en.wikipedia.org/wiki/Sugarscape
Don’t know if that’s relevant, but in the third graph Nature seems to recover pretty fast after a collapse.
Lucy wrote:
Actually their equations (as opposed to whatever they might say) don’t state any relation between being ‘elite’ or ‘commoner’ and wealth. They say that:
• The elite and the commoners may have different birth rates.
• Elites only have elite children, commoners only have commoner children.
• There is no social mobility: members of the elite don’t become commoners or vice versa.
• The elites and commoners may have different death rates, which are functions of the total wealth of society.
• The elites and commoners consume wealth at different rates, which are functions of the total wealth of society.
• Only commoners convert natural resources into wealth.
Clearly some of these assumptions are more plausible than others. There’s lots of room for making things more complicated, but are there any changes to the formalism that make it significantly more realistic without making it much more complicated? What change would give the most ‘bang for the buck’?
The model is at the level of populations, not individuals. For example, if
• individuals who change class acquire the characteristics of that class
and
• the rate at which elites become commoners equals that at which commoners become elites
then it seems to me that the model applies.
You’re right, thanks! Of course this assumption
• the rate at which elites become commoners equals that at which commoners become elites
is still restrictive, but it might be an acceptable approximation at the level we’re working at here.
You’re making me want to learn more about social mobility, and the rise and fall of the middle class in various situations. What kind of fraction of people make a transition in or out of the ‘elite’ (however we define it) in their lives? And how important for economic modelling it to divide people not just into ‘elite’ and ‘commoners’ but something more fine-grained, like ‘upper class’, ‘middle class’ and ‘lower class’?
An econophysics paper from 2010 shows a very clear difference between lower and upper class people. Basically, income falls into two distinct mathematical categories: additive and multiplicative. Additive income is independent of wealth and comes from some type of work, trading personal effort for money. Multiplicative income is investment or interest income, and is proportional to wealth. This leads income to be separable as the sum of two distributions, a Boltzmann distribution for lower class people who work and a power law distribution for upper class people whose wealth works. Currently, 97% of Americans fall into the lower working class and 3% fall into the upper investor class.
Interestingly, the paper concludes that a power law exponent, alpha, of 2 is stable, and that anything less than 2 is unstable. Alpha in the US decreased from 1.9 to 1.3 between 1983 and 2007 as the economy’s stability has decreased. If alpha reaches 1.0, the total income of the upper class diverges mathematically to infinity. This could be the cause of at least an economic collapse and perhaps a civilization-wide collapse.
While it is an interesting exercise this reminds much of ecological models such as hare and bobcats or ticks, deer and oak trees. A small set of equations, assumptions, and parameters can make interesting graphs, some of which might be useful.
While in the past some societies may have collapsed due to resource depletion, resources are actually what we make them to be, based on utility(Easter Island), cost, and substitution. There is plenty of flint available to make arrowheads for hunting now. There didn’t used to be. Good flint was traded, at great cost, far and wide across the Americas. As better ways to hunt for food and wage wars the need for flint rapidly disappeared.
However, most of the examples mentioned seemed to be caused by natural disasters such as extended droughts or climate change. The fall of Rome, the movements of the Barbarians appear to be caused by the cooling of the climate after the Roman climate optimum. The several civilizations in Central America appear to fall mainly to drought. Despite large scale public works, most of the populations lived within one bad harvest of starvation. A bad harvest or outbreak of disease could completely disrupt the culture. In most cases they could or would not adapt to such external changes. Part of the reason the Vikings left Greenland, despite the fact that the Inuit were living there pretty successfully, was that the Viking culture refused to adopt Inuit ways and those who could went back to Europe.
Birth rates are not fixed. Birth rate depends on the cost of energy. When energy is expensive(all work done manually) the birth rate is high both among elites and commoners due to the need for many hands for work and the high death rate of infants and children and adults. As the cost of energy comes down increased wealth causes a drastic drop in birth rate.
The article does not define wealth. Wealth is the accumulated surplus production. It may include public works(roads, plumbing, buildings, etc), hoards of precious metals or gems, savings(whether in money or goods) etc. An efficient society manages the wealth through supply and demand, producing what is needed when and where it is needed, with the primary profits going to the producers. The more concentrated and centrally controlled the wealth is the less efficiency there is and the less adaptable the society is to upsets whether from climate change or wars or disease.
The authors claim that they understand some of the reasons of civilisational decline (whatever that is), but fail to provide evidence that their model does indeed explain say the downfall of the Roman empire. Isn’t that a standard test for such models that they have to reproduce historical data before one tries to predict the future?
Good point, it would certainly be nice to see how their model does for other collapses. This reminds me of something I wrote in Anasazi America (Part 2):
“Anasazi” isn’t a word in the Anasazi language, whatever that might have been. It’s Navajo, and it means “enemy”. In the last years of the Anasazi culture, they became cannibals, and raided Navajo settlements and took captives – as a source of food. Later, settlements of Anasazi began warring amongst themselves – and practiced cannibalism – so that’s a possible route of collapse. http://archive.archaeology.org/9709/newsbriefs/anasazi.html
A few comments:
First, the fact that only workers produce wealth cannot be, in my opinion, an acceptable description of reality. In fact capital is becoming more and more important with respect to labor, as a production factor. The implication could very well be that the elite would be able to survive without workers, (though under the current system the elite needs consumers, but that’s another story).
Second,
I actually agree with this aspect of the model. Put it another way halving the amount of resources halves the utilization rate, which i think it’s realistic for at least two reasons. The reason number two is that extraction costs can go up as resources become harder to find. The reasons number one is that as a resource become scarcer its price goes up and people cannot afford using it at the same rate anymore.
Third, i have big trouble wrapping my head around the wealth equation. I’m ok with the fact that wealth gets converted from natural resources, so i’m fine with:
which suggests to me that wealth could be something like the integral, over time, of the world GDP. This wealth would get depleted slowly over time by some erosion process and could get devalued by inflation, but for the sake of simplicity we could assume that depletion and/or devaluation do not occur.
What really troubles me are the consumption terms, which i don’t think can be thought as consumption in the normal economics meaning of the word, since money doesn’t get consumed, just passed around. I really don’t know what it means for wealth to be “consumed”.
So probably i am not clear about what exactly wealth means in practice here and how you can measure or estimate it. I would probably have introduced either two separate wealth variables for elite and workers, (or equivalently a distribution factor). That could have made the model more realistic and would have avoided assuming different death rates, which seems too much of a stretch to me.
A larger point is that i would have tried to somehow use numbers that are known and measurable like actual population, actual GDP, actual amount (or value) of estimated resources … stuff like that, instead of having values going from 0 to 1. It’s true that it would be an HUGE amount of work but perhaps worthy (and perhaps someone has already done it somewhere).
But i don’t want to sound too critical, i think that overall this is a really nice and needed effort, and the general approach (as well as 3 out of 4 equations) make a lot of sense to me.
Ok, i think wealth here refers practically to “everything money can buy” not really money itself, which gets consumed (or depleted) according to Cc and Ce, so now i think the fourth equation makes sense if seen under this light.
It might make sense to have birth rates depend on the consumption rates as increased consumption increases at least the number of wealthy people, (while if nothing gets consumed people die, which is actually modeled in death rates to some extent).
One more thing, shouldn’t the consumption rates depend on the actual number of people as well as the total wealth (because more people consume more wealth) ? In other words shouldn’t the last equation be something like:
Yes you might model this effect with the first term somehow but i think it would be less intuitive. Anyway, not sure, something to think about.
I’ve printed the paper, i’ll see if i can get around doing some simulations if i have a few hours his weekend.
I am thinking that a statistical study can be made on old civilizations (with extinction for internal causes, or with a long dynamical period), with a writing system (after 3200 ac), an evoluted administrative system, a sistematic census, a long period of peace and absence of great disease (to simplify the system).
There are the Roman empire, Chinese dynasties, the Babylonian dynasties, the Achaemenid empire, but the classical Athens and Sparta have had too conflicts to obtain a simple dynamic.
I see that in each civilization exist always more of two classes, Politburo and people, National People’s congress and people, with hereditaries positions; so that each civilization have hereditaries position, also in democratic systems (nepotism), that can give a little different dynamic (caste system in India can complicate the system, but lower classe and higher classe can simplify the dynamic).
I don’t understand some points. with the wealth, then these variations can be write in the differential equation without constraint:

If there is a variation of the parameters
so that the variation of the population depend on the wealth (there is a grow of the population if the wealth is high, there is a reduction of the population if the wealth is low), and there are only two parameters in the population equation: there are not new born death in the population, and in the young, if the wealth is high
Could The same be write for the change of the wealth?
If it is possible to write a differential equation for the dynamic without min() and max() functions, then it is possible to write the analytical solution for some parameters values, or to obtain the equilibrium points.
I think you’re right. And furthermore… The piecewise-linear functions of wealth are pretty arbitrary. If the conclusions depend on the precise shape of these functions, we may as well give up. For all practical purposes, we can avoid min() and max(). I think we can go further, and choose any roughly similar functions that are analytically convenient.
I am thinking that it is possible to write the simpler laws, for a civilization, without too many parameters; this simple law have a validity in a little neighbourhood, it is possible to obtain the equilibrium point, to study the asymptotic behaviout, and to obtain the numerical solution without constraint.
Each civilization law can be an approximation of a real differential equation of order n, with a Cauchy problem solution with ordinary differential equation (like Handy model).
I am thinking that exist a frontier, for each civilization problem, so that the max() and min() function can be seen like a constrain on the velocity (a constrain on a surface, so that must be a insurmontable wall that block the dynamic); this can be made with a drag term for each velocity field.
I am thinking that each civilization dynamic can be product with an elementary interaction, like a chemical interaction, where the interaction of a man with a woman give a birth (with a certain probability, that for some wimps can be very low), an interaction of a man with the wealth give health, the interaction of a man with some sources give a technological product, and so on; so that a civilization can be transformed in a chemical reaction of some elementary particles in complex molecules with use of energy.
I think that this can be important, for the balanced use of the natural resource with a stable civilization.
Domenico- “I see that in each civilization exist always more of two classes, Politburo and people, National People’s congress and people, with hereditaries positions”
One hallmark of every developed system, at least in Europe and Asia, has been the development of a middle class- the storekeepers, traders, bankers, and industry- everybody outside of the farmers or perhaps peasants. Without a middle class, and in more developed societies even more in-between classes, society cannot function efficiently.
Jared Diamond also describes how previous societies have tended to collapse on resource exhaustion, although he describes it in a less mathematical and more empirical fashion.
Over on G+, Praveen Kulkarni pointed out a related paper by some of the same authors:
• Rodrigo Castro, Peter Fritzson, François Cellier, Safa Motesharrei, and Jorge Rivas, Human-nature interaction in world modeling with Modelica, Proceedings of the 10th International Modelica Conference, March 10-12, 2014, Lund, Sweden.
My blog article mentioned this story:
• Keith Kloor, About that popular Guardian story on the collapse of industrial civilization, Collide-A-Scape, blog on Discover, March 21, 2014.
But I failed to mention the (to me) more interesting “part 2”:
• Keith Kloor, Judging the merits of a media-hyped ‘Collapse’ Study, Collide-A-Scape, blog on Discover, March 21, 2014.
This has some remarks by Joseph Tainter, author of The Collapse of Complex Societies, a book I should discuss here someday. He writes:
I agree with Tainter. Before you have a mathematical model you need a conceptual model. If we are going to look at human nature then it has to be based on evolution. Something like https://docs.google.com/document/d/10s29n1saUnP9ELVFqZVEVcUN2M_c_ZJP6wE-yCQw6nc/edit?usp=sharing [without specifically endorsing my amateur ramblings, though I am naturally rather fond of them]. Once you have a clear idea of how human nature works (my ramblings would be only a start, even if you agree with them), then you might be able to build a mathematical model, but I believe that individuals and groups are inclined to phase transitions that make this hard.
Over on G+, Michael Deakin suggests that this could be the paper that all the fuss is about:
• Safa Motesharrei, Jorge Rivas, Eugenia Kalnay, Human and nature dynamics (HANDY): modeling inequality and use of resources in the collapse or sustainability of societies, 19 March 2014.
It’s certainly closely related! It’s similar to the one I talked about, but it’s got more details about the many different scenarios that can arise in this model.
In a society having advanced technology, resource depletion is a red herring as long as abundant free energy is available at a fair price. Thermodynamic limit of energy needed for ore enrichment is proportional to the logarithm of concentration, therefore even the poorest ore can serve as a resource.
As for free energy, well, we have this huge gravitational fusion reactor nearby, with an output of some 3.85×10²⁶ W and we don’t even know how to turn it off. Breeder reactors are also sustainable for the rest of the lifetime of our solar system. The cycle can certainly be designed in a way that no long half life isotope is left in waste, so we can make-do with a waste deposit of limited size in the long run.
Just in case no one has noticed, let me tell you that modern population explosion is already over, number of people under 15 is not increasing any more. World population will still increase for some time, because life expectancy is increasing and people have a better chance to grow old before dying, but that can’t possibly lead to exponential growth.
Recent substantial reduction of infant mortality along with increasing educational level of girls has this dramatic effect. Looks like human beings, at least women, are behaving rationally, after all.
Civilization may well collapse in the coming century, but if it does, for reasons entirely different from those surmised by the authors.
>Breeder reactors are also sustainable for the rest of the lifetime of our solar system.
In the study you cited, one can find already on a first glance some points which seem very problematic in the sense that your assertion seems rather unlikely.
Since the author talks about using uranium in breeders, I assume that when he talks about uranium he is in particular including uranium 238, he also talks about 1000 years availability, which would be roughly in accordance with common agreement, one would though need to check wether the numbers are correspondingly in order to check wether this is right. Lets assume his assumptions about efficiency etc. are right then still:
– a constant rate of uranium erosion via rivers is assumed and it is assumed that half of the in the earths crust uranium could be depleted in this way.
This seems rather unlikely.
-The article is from 1983 the world energy consumption has meanwhile raised about three-fold, so that at least you have to divide the time of “life on earth” by three, which would leave you already now with only roughly 1 billion years. This trend may continue, due to Jevons paradox.
-The cost analysis seems to take e.g. no waste costs, rising water shortages (in particular water from rivers) and nuclear accident compensations into consideration, apart from this I find it rather questionable wether a cost analysis for the next one billion years makes sense at all.
And then finally it is a question wether one shouldn’t let the earth go on space travels like e.g. to meat some aliens. One would certainly need a lot of energy to accomplish that.
On which statistics is this based on?
You can look up stuff at e.g. the UN site.
World
Population aged 0-14
Medium variant
1950-2010
Global population explosion has obviously stopped 2 decades ago. I have no theory why this important development was never widely communicated in the mainstream media.
no it didn’t seem to stay really constant on a first glance. that is the ditch in 2005 is probably to be explained by the aids pandemic (here an example) and for 2015 the UN registry says:
2010 1 842 237 26.6
2015 1 904 088 26.0
which would be very roughly half the increase as in the sixties (on a one second estimation) and that would be rather alarming.
By the way concerning the expectency of life on earth: Before turning in about 5.4 billion years into a red giant the suns luminosity may make earth probably already before that time quite unhabitable, but I havent looked into that more carefully.
moreover I wrote:
Would be interesting to know wether one could eventually revisit the sun after it has cooled down as a white dwarf.
That itsy-bitsy flaw can certainly be corrected, for a while.
However, no one really knows what to expect in billions of years. My own country, for example, will be gone in a meager hundred million years, pushed under Transylvania by the relentlessly approaching Italian peninsula, but I am not particularly anxious about it. Prediction is very difficult, especially about the future.
We don’t even know what’s going to come in the next century. By that time molecular sorters will be available perhaps, which makes extracting Uranium from crust a bit easier than waiting for plate tectonics to do the job for us. And then, we also have Thorium along with fifty thousand gigatons of Deuterium in the ocean.
Solar power is also an option, especially in interplanetary space, where real estate is cheap and the sun shines 7×24 hours a week.
The point is we have plenty of power by any measure as long as population will not keep increasing exponentially, by many orders of magnitude.
I would worry more about a demodularization crisis, than about resource depletion or population explosion. Which itself, of course, is consistent with the utter incompetence of elites.
It does say that, for “Medium variant”. However, that’s not a fact, that’s a prediction. There’s a difference, because 2015 is still hidden conveniently in the future (the uncertainty of this UN estimate is about ±67.5 million).
However, we have factual data for 2012, which shows 1,841,000 thousand people under 15, making the “Medium variant” for 2015 somewhat unlikely. On top of that it is also a fact, that number of people below 15 was stable for the last 2 decades.
Still, we could agree on sending African warlords &. tyrants to hell would be a good idea, which would make improving female education, decreasing infant mortality &. raising health standards a bit easier for the very peoples involved.
Yes if this is the actual data then it looks as if the trend is more in between the medium and the low variant, which is for 2015:
1 836 231 .
Where did you find the data? – its not in the online detailed indicators…at least I didnt see it there. Is it in the dat or csv data files?
Well anyways I still think that the declining trend is not so evident. The past events seem to be actual data, so we have:
actual data:
1990 1 750 648 32.9
1995 1 832 106 31.9
2000 1 846 792 30.1
2005 1 821 777 28.0 (decline probably due to Aids)
2010 1 842 237 26.6
2012 1,841,000
That is before 2000 the population was clearly growing. After that there was this ditch which is probably due to Aids and then
it was rising again until 2010, although not to the previous level.
That is only in the “pandemic years” and in the two years since 2010 a decline could be observed with this given data. I wouldn’t call this stable:
As said the estimations were revised in 2012 so one can assume that the pandemic was somewhat taken into account and the estimations for 2015 are again:
the medium variant estimation is for 2015:
2015 1 904 088 26.0
the low variant estimation is for 2015:
2015 1 836 231 25.3
So the 2012 actual data is between the medium and the low variant estimation for 2015. The low variant estimation describes an immediate decline and the medium variant a decline around 2055. So if the data points to something then rather to a decline in some years before 2055, but not necessarily now. Is there already data for 2013?
I think that the raise of “machines” could be interpreted as a population growth of “brain childs”. That is it seems human population growth may be substituted by “machinistic population growth”, at least in northern countries it looks as if this is already the case. And we don’t know yet how the energy demand of that “new inhabitants” is going to develop. I am writing about this here and here
I don’t think this AIDS pandemic theory can hold water. Global child mortality is decreasing steadily all along.
World
Under-five mortality
Medium variant
1950-2010
In 2005-2010 it was 4 child deaths per 1,000 live births in Japan, 5 in Western Europe and 8 in Northern America, so there is still room for improvement.
The more child mortality is, the higher birth rates will become, simply because people, especially women are becoming desperate. Compared to current capabilities, 6 fatalities out of 100 live births is way too high.
As soon as child mortality is down, increasing female education suppresses population growth effectively in a culture independent manner. General educational level of males has no such effect.
Nope, plenty is plenty.
See United States Per Capita Energy Use
From Wikipedia:
http://en.wikipedia.org/wiki/Aids#Clinical_latency
and
From the world health organisation:
If these facts are true then I find the mortality rates rather self-explanatory, but of course there is always a possibility that one has overseen something.
I wrote:
by the way do you know where the old estimations are? It would be interesting to see how good previous UN predictions had been.
In particular it is somewhat annoying that older figures and data seems to disappear like e.g. that
link, which have I linked to in my article.
I find that rather problematic. I would expect that the UN is a reliable source. It is very important to see how good predictions had been in the past in order to get a glimpse on their accuracy and to see tendencies.
In the article I cited:
The 2012 revision says:
low variant: 2050 8 341 706
2100 6 750 256
medium variant: 2050 9 550 945
2100 10 853 849
high variant: 2050 10 868 444
2100 16 641 244
So it seems things get actually worse rather fast.
Your table about the energy use per capita in the US
has to be seen together with the population growth in the US
1950 151,325,798 14.5%
1960 179,323,175 18.5%
1970 203,211,926 13.3%
1980 226,545,805 11.5%
1990 248,709,873 9.8%
2000 281,421,906 13.2%
2010 308,745,531 9.7%
I don’t know how big the percentage is here due to immigration,
unfortunately the Wikipedia section on immigration is not very exhaustive here.
The energy use in the US is quite high, in particular due to immigration it seems quite some people moved from a lower energy use region into a higher energy use region. Well life is certainly easier if you can “spil”l energy. But can you really spill? (here a table of the Oil and Gas reserves per capita in US dollars (it seems growing prices had been taken somewhat into account) and if you do then for what?
I wrote:
At least the 2010 data release is still at least partially to be found at: 2010. I didn’t check the numbers again though.
Indeed. In a sane world they would have put it under revision control with plenty of documentation concerning changes.
Anyway, they have managed to beef up trends, both historic and predicted ones in just 2 years. A valiant feat, which makes difficult to take it seriously.
rev. 2010: Table A.31. pp. 372-405
rev. 2012
World
Population aged 0-14
Medium variant
1950-2100
Year rev. 2010 rev. 2012 (thousands) 1950 869025 867652 1955 983385 1960 1128118 1122738 1965 1263472 1970 1384365 1387081 1975 1498550 1980 1572373 1567572 1985 1645078 1643673 1990 1737312 1750648 1995 1819943 1832106 2000 1849266 1846792 2005 1835348 1821777 2010 1846675 1842237 2015 1877551 1904088 2020 1906952 1957731 2025 1981671 2030 1907229 1981035 2035 1983767 2040 1899655 1998396 2045 2018553 2050 1907753 2034447 2055 2040926 2060 1893759 2039906 2065 2035476 2070 1875380 2030627 2075 2025087 2080 1861332 2016623 2085 2003819 2090 1838789 1986477 2095 1966266 2100 1814185 1944239May be this is due to some methodological changes. I mean even these numbers are not fully found by counting, but probably partially estimated. The pdf is so big that I can’t quite scroll in it.
Just to make sure, it should be clear from the context of the discussion but with
I meant that the UN coud have kept their URL’s at least archived. I think the UN data is mostly reliable and a good guideline. Where else does one find this data? May be the UN used internally a revision control system, but yes for the online tab display that would be helpful.
On the other hand, here’s a more reasonable sort of collapse scenario/model which might be a bit more imminent: http://www.feasta.org/wp-content/uploads/2012/06/Trade-Off1.pdf
“It is argued that in order to understand systemic risk in the globalised economy, account must be taken of how growing complexity (interconnectedness, interdependence and the speed of processes), the de-localisation of production and concentration within key pillars of the globalised economy have magnified global vulnerability and opened up the possibility of a rapid and large- scale collapse. ‘Collapse’ in this sense means the irreversible loss of socio-economic complexity which fundamentally transforms the nature of the economy. These crucial issues have not been recognised by policy-makers nor are they reflected in economic thinking or modelling.
As the globalised economy has become more complex and ever faster (for example, Just-in-Time logistics), the ability of the real economy to pick up and globally transmit supply-chain failure, and then contagion, has become greater and potentially more devastating in its impacts. In a more complex and interdependent economy, fewer failures are required to transmit cascading failure through socio-economic systems. In addition, we have normalised massive increases in the complex conditionality that underpins modern societies and our welfare. Thus we have problems seeing, never mind planning for such eventualities, while the risk of them occurring has increased significantly. The most powerful primary cause of such an event would be a large-scale financial shock initially centring on some of the most complex and trade central parts of the globalised economy.
The argument that a large-scale and globalised financial-banking-monetary crisis is likely arises from two sources. Firstly, from the outcome and management of credit over-expansion and global imbalances and the growing stresses in the Eurozone and global banking system. Secondly, from the manifest risk that we are at a peak in global oil production, and that affordable, real-time production will begin to decline in the next few years. In the latter case, the credit backing of fractional reserve banks, monetary systems and financial assets are fundamentally incompatible with energy constraints. It is argued that in the coming years there are multiple routes to a large- scale breakdown in the global financial system, comprising systemic banking collapses, monetary system failure, credit and financial asset vaporization. This breakdown, however and whenever it comes, is likely to be fast and disorderly and could overwhelm society’s ability to respond.”
The article has been published and is freely accessible here:
http://dx.doi.org/10.1016/j.ecolecon.2014.02.014
Enjoy…
D.
Great!
In the review of reactions to the article Keith Kloor wrote about the reaction of Mark Sagoff:
And in fact World3 seems to had been based on a Lotka-Volterra system, that is at least Brian Hayes wrote:
It seems though that the involved quantities in world3 and the above article are different. It could actually be useful to compare the equations, however I haven’t seen the formulas on the web.
And it looks cumbersome to extract them from Brian Hayes source code.
Do you really need differential equations to see that a system that consumes resources beyond any meaningful measure and, in addition, misallocates wealth is doomed?
Certainly it is scientific to develop models and analyze them but for me and in this special case is has a very bitter taste to model things that are plain obvious instead of doing something against it.
I think it is usually debated what misallocated means or would an oligarch who buys his 15th car say this expense was misallocated?
World3 is probably more equipped to deal with the global problems facing us today than HANDY. It is interesting to compare the actual data with the predictions of World3 modelling. See An update of data for World3.
The data suggest that the next 5 years will be make or break time.
Thanks for the hint—I should learn more about World3.
HANDY is a very simple model which leaves out many of the key aspects of our current situation, so it wouldn’t be hard for World3 to be a better guide to the problems facing us now.
The authors of HANDY try to correct the misinterpretations of their article:
http://www.elsevier.com/connect/q-and-a-when-a-theoretical-article-is-misinterpreted
Enjoy again…
D.
That’s a nice explanation, much better than the original press accounts.
Here’s Motesharrei explaining his work in a slightly more down to earth manner: https://www.youtube.com/watch?v=nec1qvbYrag
• Part 1: the rise of the ancient Puebloan civilization in the American Southwest from 10,000 BC to 750 AD.
• Part 2: the rise and collapse of ancient Puebloan civilization from 750 AD to 1350 AD.
• Part 3: a simplified model of civilizational collapse.
• Part 4: the collapse of Greek science and the resulting loss of knowledge.