In "week301" I sketched a huge picture in a very broad brush. Now I’d like to start filling in a few details: not just about the problems we face, but also about what we can do to tackle them. For the reasons I explained last time, I’ll focus on what scientists can do.
As I’m sure you’ve noticed, different people have radically different ideas about the mess we’re in, or if there even is a mess.
Maybe carbon emissions are causing really dangerous global warming. Maybe they’re not — or at least, maybe it’s not as bad as some say. Maybe we need to switch away from fossil fuels to solar power, or wind. Maybe nuclear power is the answer, because solar and wind are intermittent. Maybe nuclear power is horrible! Maybe using less energy is the key. But maybe boosting efficiency isn’t the way to accomplish that.
Maybe the problem is way too big for any of these conventional solutions to work. Maybe we need carbon sequestration: like, pumping carbon dioxide underground. Maybe we need to get serious about geoengineering — you know, something like giant mirrors in space, to cool down the Earth. Maybe geoengineering is absurdly impractical — or maybe it’s hubris on our part to think we could do it right! Maybe some radical new technology is the answer, like nanotech or biotech. Maybe we should build an intelligence greater than our own and let it solve our problems.
Maybe all this talk is absurd. Maybe all we need are some old technologies, like traditional farming practices, or biochar: any third-world peasant can make charcoal and bury it, harnessing the power of nature to do carbon sequestration without fancy machines. In fact, maybe we need go back to nature and get rid of the modern technological civilization that’s causing our problems. Maybe this would cause massive famines. But maybe they’re bound to come anyway: maybe overpopulation lies at the root of our problems and only a population crash will solve them. Maybe that idea just proves what we’ve known all along: the environmental movement is fundamentally anti-human.
Maybe all this talk is just focusing on symptoms: maybe what we need is a fundamental change in consciousness. Maybe that’s not possible. Maybe we’re just doomed. Or maybe we’ll muddle through the way we always do. Maybe, in fact, things are just fine!
To help sift through this mass of conflicting opinions, I think I’ll start by interviewing some people.

I’ll start with Nathan Urban, for a couple of reasons. First, he can help me understand climate science and the whole business of how we can assess risks due to climate change. Second, like me, he started out working on quantum gravity! Can I be happy switching from pure math and theoretical physics to more practical stuff? Maybe talking to him will help me find out.
So, here is the first of several conversations with Nathan Urban. This time we’ll talk about what it’s like to shift careers, how he got interested in climate change, and issue of "climate sensitivity": how much the temperature changes if you double the amount of carbon dioxide in the Earth’s atmosphere.
JB: It’s a real pleasure to interview you, since you’ve successfully made a transition that I’m trying to make now — from "science for its own sake" to work that may help save the planet.
I can’t resist telling our readers that when we first met, you had applied to U.C. Riverside because you were interested in working on quantum gravity. You wound up going elsewhere… and now you’re at Princeton, at the Woodrow Wilson School of Public and International Affairs, working on "global climate change from an Earth system perspective, with an emphasis on Bayesian data-model calibration, probabilistic prediction, risk assessment, and decision analysis". That’s quite a shift!
I’m curious about how you got from point A to point B. What was the hardest thing about it?
NU: I went to Penn State because it had a big physics department and one of the leading centers in quantum gravity. A couple years into my degree my nominal advisor, Lee Smolin, moved to the Perimeter Institute in Canada. PI was brand new and didn’t yet have a formal affiliation with a university to support graduate students, so it was difficult to follow him there. I ended up staying at Penn State, but leaving gravity. That was the hardest part of my transition, as I’d been passionately interested in gravity since high school.
I ultimately landed in computational statistical mechanics, partly due to the Monte Carlo computing background I’d acquired studying the dynamical triangulations approach to quantum gravity. My thesis work was interesting, but by the time I graduated, I’d decided it probably wasn’t my long term career.
During graduate school I had become interested in statistics. This was partly from my Monte Carlo simulation background, partly from a Usenet thread on Bayesian statistics (archived on your web page), and partly from my interest in statistical machine learning. I applied to a postdoc position in climate change advertised at Penn State which involved statistics and decision theory. At the time I had no particular plan to remain at Penn State, knew nothing about climate change, had no prior interest in it, and was a little skeptical that the whole subject had been exaggerated in the media … but I was looking for a job and it sounded interesting and challenging, so I accepted.
I had a great time with that job, because it involved a lot of
statistics and mathematical modeling, was very interdisciplinary — incorporating physics, geology, biogeochemistry, economics, public policy, etc. — and tackled big, difficult questions. Eventually it was time to move on, and I accepted a second postdoc at Princeton doing similar things.
JB: It’s interesting that you applied for that Penn State position even though you knew nothing about climate change. I think there are lots of scientists who’d like to work on environmental issues but feel they lack the necessary expertise. Indeed I sometimes feel that way myself! So what did you do to bone up on climate change? Was it important to start by working with a collaborator who knew more about that side of things?
NU: I think a physics background gives people the confidence (or arrogance!) to jump into a new field, trusting their quantitative skills to see them through.
It was very much like starting over as a grad student again — an experience I’d had before, switching from gravity to condensed matter — except faster. I read. A lot. But at the same time, I worked on a narrowly defined project, in collaboration with an excellent mentor, to get my feet wet and gain depth. The best way to learn is probably to just try to answer some specific research question. You can pick up what you need to know as you go along, with help. (One difficulty is in identifying a good and accessible problem!)
I started by reading the papers cited by the paper upon whose work my research was building. The IPCC Fourth Assessment Report came out shortly after that, which cites many more key references. I started following new articles in major journals, whatever seemed interesting or relevant to me. I also sampled some of the blog debates on climate change. Those were useful to understand what the public’s view of the important controversies may be, which is often very different from the actual controversies within the field. Some posters were willing to write useful tutorials on some aspects of the science as well. And of course I learned through research, through attending group meetings with collaborators, and talking to people.
It’s very important to start out working with a knowledgeable collaborator, and I’m lucky to have many. The history of science is littered with very smart people making serious errors when they get out of their depth. The physicist Leo Szilard once told a biologist colleague to "assume infinite intelligence and zero prior knowledge" when explaining to him. The error some make is in believing that intelligence alone will suffice. You also have to acquire knowledge, and become intimately familiar with the relevant scientific literature. And you will make mistakes in a new field, no matter how smart you are. That’s where a collaborator is crucial: someone who can help you identify flaws in arguments that you may not notice yourself at first. (And it’s not just to start with, either: I still need collaborators to teach me things about specific models, or data sets, that I don’t know.) Collaborators also can help you become familiar with the literature faster.
It’s helpful to have a skill that others need. I’ve built up expertise in statistical data-model comparison. I read as many statistics papers as I do climate papers, have statistician collaborators, and can speak their own language. I can act as an intermediary between scientists and statisticians. This expertise allows me to collaborate with some climate research groups who happen to lack such expertise themselves. As a result I have a lot of people who are willing to teach me what they know, so we can solve problems that neither of us alone could.
JB: You said you began with a bit of skepticism that perhaps the whole climate change thing had been exaggerated in the media. I think a lot of people feel that way. I’m curious how your attitude evolved as you began studying the subject more deeply. That might be a big question, so maybe we can break it down a little: do you remember the first thing you read that made you think "Wow! I didn’t know that!"?
NU: I’m not sure what was the first. It could have been that most of the warming from CO2 is currently thought to come from feedback effects, rather than its direct greenhouse effect. Or that ice ages (technically, glacial periods) were only 5-6 °C cooler than our preindustrial climate, globally speaking. Many people would guess something much colder, like 10 °C. It puts future warming in perspective to think that it could be as large, or even half as large, as the warming between an ice age and today. "A few degrees" doesn’t sound like much (especially in Celsius, to an American), but historically, it can be a big deal — particularly if you care about the parts of the planet that warm faster than the average rate. Also, I was surprised by the atmospheric longevity of CO2 concentrations. If CO2 is a problem, it will be a problem that’s around for a long time.
JB: These points are so important that I don’t want them to whiz past too quickly. So let me back up and ask a few more questions here.
By "feedback effects", I guess you mean things like this: when it gets warmer, ice near the poles tends to melt. But ice is white, so it reflects sunlight. When ice melts, the landscape gets darker, and absorbs more sunlight, so it gets warmer. So the warming effect amplifies itself — like feedback when a rock band has its amplifiers turned up too high.
On the other hand, any sort of cooling effect also amplifies itself. For example, when it gets colder, more ice forms, and that makes the landscape whiter, so more sunlight gets reflected, making it even colder.
Could you maybe explain some of the main feedback effects and give us numbers that say how big they are?
NU: Yes, feedbacks are when a change in temperature causes changes within the climate system that, themselves, cause further changes in temperature. Ice reflectivity, or "albedo", feedback is a good example. Another is water vapor feedback. When it gets warmer — due to, say, the CO2 greenhouse effect — the evaporation-condensation balance shifts in favor of relatively more evaporation, and the water vapor content of the atmosphere increases. But water vapor, like CO2, is a greenhouse gas, which causes additional warming. (The opposite happens in response to cooling.) These feedbacks which amplify the original cause (or "forcing") are known to climatologists as "positive feedbacks".
A somewhat less intuitive example is the "lapse rate feedback". The greenhouse effect causes atmospheric warming. But this warming itself causes the vertical temperature profile of the atmosphere to change. The rate at which air temperature decreases with height, or lapse rate, can itself increase or decrease. This change in lapse rate depends on interactions between radiative transfer, clouds and convection, and water vapor. In the tropics, the lapse rate is expected to decrease in response to the enhanced greenhouse effect, amplifying the warming in the upper troposphere and suppressing it at the surface. This suppression is a "negative feedback" on surface temperature. Toward the poles, the reverse happens (a positive feedback), but the tropics tend to dominate, producing an overall negative feedback.
Clouds create more complex feedbacks. Clouds have both an albedo effect (they are white and reflect sunlight) and a greenhouse effect. Low clouds tend to be thick and warm, with a high albedo and weak greenhouse effect, and so are net cooling agents. High clouds are often thin and cold, with low albedo and strong greenhouse effect, and are net warming agents. Temperature changes in the atmosphere can affect cloud amount, thickness, and location. Depending on the type of cloud and how temperature changes alter its behavior, this can result in either positive or negative feedbacks.
There are other feedbacks, but these are usually thought of as the big four: surface albedo (including ice albedo), water vapor, lapse rate, and clouds.
For the strengths of the feedbacks, I’ll refer to climate model predictions, mostly because they’re neatly summarized in one place:
• Section 8.6 of the Intergovernmental Panel on Climate Change Fourth Assessment Report, Working Group 1 (AR4 WG1).
There are also estimates made from observational data. (Well, data plus simple models, because you need some kind of model of how temperatures depend on CO2, even if it’s just a simple linear feedback model.) But observational estimates are more scattered in the literature and harder to summarize, and some feedbacks are very difficult to estimate directly from data. This is a problem when testing the models. For now, I’ll stick to the models — not because they’re necessarily more credible than observational estimates, but just to make my job here easier.
Conventions vary, but the feedbacks I will give are measured in units of watts per square meter per kelvin. That is, they tell you how much of a radiative imbalance, or power flux, the feedback creates in the climate system in response to a given temperature change. The reciprocal of a feedback tells you how much temperature change you’d get in response to a given forcing.
Water vapor is the largest feedback. Referring to this paper cited in the AR4 WG1 report:
• Brian J. Solden and Isaac M. Held, An assessment of climate feedbacks in coupled ocean-atmosphere models, Journal of Climate 19 (2006), 3354-3360.
you can see that climate models predict a range of water vapor feedbacks of 1.48 to 2.14 W/m2/K.
The second largest in magnitude is lapse rate feedback, -0.41 to -1.27 W/m2/K. However, water vapor and lapse rate feedbacks are often combined into a single feedback, because stronger water vapor feedbacks also tend to produce stronger lapse rate feedbacks. The combined water vapor+lapse rate feedback ranges between 0.81 to 1.20 W/m2/K.
Clouds are the next largest feedback, 0.18 to 1.18 W/m2/K. But as you can see, different models can predict very different cloud feedbacks. It is the largest feedback uncertainty.
After that comes the surface albedo feedback. Its range is 0.07 to 0.34 W/m2/K.
People don’t necessarily find feedback values intuitive. Since
everyone wants to know what that means in terms of the climate, I’ll explain how to convert feedbacks into temperatures.
First, you have to assume a given amount of radiative forcing: a stronger greenhouse effect causes more warming. For reference, let’s consider a doubling of atmospheric CO2, which is estimated to create a greenhouse effect forcing of 4±0.3 W/m2. (The error bars represent the range of estimates I’ve seen, and aren’t any kind of statistical bound.) How much greenhouse warming? In the absence of feedbacks, about 1.2±0.1 °C of warming.
How much warming, including feedbacks? To convert a feedback to a temperature, add it to the so-called "Planck feedback" to get a combined feedback which accounts for the fact that hotter bodies radiate more infrared. Then divide it into the forcing and flip the sign to get the warming. Mathematically, this is….
JB: Whoa! Slow down! I’m glad you finally mentioned the "Planck feedback", because this is the mother of all feedbacks, and we should have talked about it first.
While the name "Planck feedback" sounds technical, it’s pathetically simple: hotter things radiate more heat, so they tend to cool down. Cooler things radiate less heat, so they tend to warm up. So this is a negative feedback. And this is what keeps our climate from spiralling out of control.
This is an utterly basic point that amateurs sometimes overlook — I did it myself at one stage, I’m embarrassed to admit. They say things like:
"Well, you listed a lot of feedback effects, and overall they give a positive feedback — so any bit of warming will cause more warming, while any bit of cooling will cause more cooling. But wouldn’t that mean the climate is unstable? Are you saying that the climate just happens to be perched at an unstable equilibrium, so that the slightest nudge would throw us into either an ice age or a spiral of ever-hotter weather? That’s absurdly unlikely! Climate science is a load of baloney!"
(Well, I didn’t actually say the last sentence: I realized I must be confused.)
The answer is that a hot Earth will naturally radiate away more heat, while a cold Earth will radiate away less. And this is enough to make the total feedback negative.
NU: Yes, the negative Planck feedback is crucial. Without this stabilizing feedback, which is always present for any thermodynamic body, any positive feedback would cause the climate to run away unstably. It’s so important that other feedbacks are often defined relative to it: people call the Planck feedback λ0, and they call the sum of the rest λ. Climatologists tend to take it for granted, and talk about just the non-Planck feedbacks, λ.
As a side note, the definition of feedbacks in climate science is
somewhat confused; different papers have used different conventions, some in opposition to conventions used in other fields like engineering. For a discussion of some of the ways feedbacks have been treated in the literature, see:
• J. R. Bates, Some considerations of the concept of climate
feedback, Quarterly Journal of the Royal Meteorological Society 133 (2007), 545-560.
JB: Okay. Sorry to slow you down like that, but we’re talking to a mixed crowd here.
So: you were saying how much it warms up when we apply a radiative forcing F, some number of watts per square meter. We could do this by turning up the dial on the Sun, or, more realistically, by pouring lots of carbon dioxide into the atmosphere to keep infrared radiation from getting out.
And you said: take the Planck feedback λ0, which is negative, and add to it the sum of all other feedbacks, which we call λ. Divide F by the result, and flip the sign to get the warming.
NU: Right. Mathematically, that’s
T = -F/(λ0+λ)
where
λ0 = -3.2 W/m2/K
is the Planck feedback and λ is the sum of other feedbacks. Let’s look at the forcing from doubled CO2:
F = 4.3 W/m2.
Here I’m using values taken from Soden and Held.
If the other feedbacks vanish (λ=0), this gives a "no-feedback" warming of T = 1.3 °C, which is about equal to the 1.2 °C that I mentioned above.
But we can then plug in other feedback values. For example, the water vapor feedbacks 1.48-2.14 W/m2/K will produce warmings of 2.5 to 4.1 °C, compared to only 1.3 °C without water vapor feedback. This is a huge temperature amplification. If you consider the combined water vapor+lapse rate feedback, that’s still a warming of 1.8 to 2.2 °C, almost a doubling of the "bare" CO2 greenhouse warming.
JB: Thanks for the intro to feedbacks — very clear. So, it seems the "take-home message", as annoying journalists like to put it, is this. When we double the amount of carbon dioxide in the atmosphere, as we’re well on the road to doing, we should expect significantly more than the 1.2 degree Celsius rise in temperature than we’d get without feedbacks.
What are the best estimates for exactly how much?
NU: The IPCC currently estimates a range of 2 to 4.5 °C for the overall climate sensitivity (the warming due to a doubling of CO2), compared to the 1.2 °C warming with no feedbacks. See Section 8.6 of the AR4 WG1 report for model estimates and Section 9.6 for observational estimates. An excellent review article on climate sensitivity is:
• Reto Knutti and Gabriele C. Hegerl, The equilibrium sensitivity of the Earth’s temperature to radiation changes, Nature Geoscience 1 (2008), 735-748.
I also recommend this review article on linear feedback analysis:
• Gerard Roe, Feedbacks, timescales, and seeing red, Annual Reviews of Earth and Planetary Science 37 (2009), 93-115.
But note that there are different feedback conventions; Roe’s λ is the negative of the reciprocal of the Soden & Held λ that I use, i.e. it’s a direct proportionality between forcing and temperature.
JB: Okay, I’ll read those.
Here’s another obvious question. You’ve listed estimates of feedbacks based on theoretical calculations. But what’s the evidence that these theoretical feedbacks are actually right?
NU: As I mentioned, there are also observational estimates of feedbacks. There are two approaches: to estimate the total feedback acting in the climate system, or to estimate all the individual feedbacks (that we know about). The former doesn’t require us to know what all the individual feedbacks are, but the second allows us to verify our physical understanding of physical feedback processes. I’m more familiar with the total feedback method, and have published my own simple estimate as a byproduct of an uncertainty analysis about the future ocean circulation:
• Nathan M. Urban and Klaus Keller, Probabilistic hindcasts and projections of the coupled climate, carbon cycle and Atlantic meridional overturning circulation system: a Bayesian fusion of century-scale observations with a simple model, Tellus A, July 16, 2010.
I will stick to discussing this method. To make a long story short, the observational and model estimates generally agree to within their estimated uncertainty bounds. But let me explain a bit more about where the observational estimates come from.
To estimate the total feedback, you first estimate the radiative forcing of the system, based on historic data on greenhouse gases, volcanic and industrial aerosols, black carbon (soot), solar activity, and other factors which can change the Earth’s radiative balance. Then you predict how much warming you should get from that forcing using a climate model, and tune the model’s feedback until it matches the observed warming. The tuned feedback factor is your observational estimate.
As I said earlier, there is no totally model-independent way of estimating feedbacks — you have to use some formula to turn forcings into temperatures. There is a balance between using simple formulas with few assumptions, or more realistic models with assumptions that are harder to verify. So far people have mostly used simple models, not only for transparency but also because they’re fast enough, and have few enough free parameters, to undertake a comprehensive uncertainty analysis.
What I’ve described is the "forward model" approach, where you run a climate model forward in time and match its output to data. For a trivial linear model of the climate, you can do something even simpler, which is the closest to a "model independent" calculation you can get: statistically regress forcing against temperature. This is the approach taken by, for example:
• Piers M. de F. Forster and Jonathan M. Gregory, The climate sensitivity and its components diagnosed from Earth radiation budget data, Journal of Climate 19 (2006), 39-52.
In the "total feedback" forward model approach, there are two major confounding factors which prevent us from making precise feedback estimates. One is that we’re not sure what the forcing is. Although we have good measurements of trace greenhouse gases, there is an important cooling effect produced by air pollution. Industrial emissions create a haze of aerosols in the atmosphere which reflects sunlight and cools the planet. While this can be measured, this direct effect is also supplemented by a far less understood indirect effect: the aerosols can influence cloud formation, which has its own climate effect. Since we’re not sure how strong that is, we’re not sure whether there is a strong or a weak net cooling effect from aerosols. You can explain the observed global warming with a strong feedback whose effects are partially cancelled by a strong aerosol cooling, or with a weak feedback along with weak aerosol cooling. Without precisely knowing one, you can’t precisely determine the other.
The other confounding factor is the rate at which the ocean takes up heat from the atmosphere. The oceans are, by far, the climate system’s major heat sink. The rate at which heat mixes into the ocean determines how quickly the surface temperature responds to a forcing. There is a time lag between applying a forcing and seeing the full response realized. Any comparison of forcing to response needs to take that lag into account. One way to explain the surface warming is with a strong feedback but a lot of heat mixing down into the deeper ocean, so you don’t see all the surface warming at once. Or you can do it with a weak feedback, and most of the heat staying near the surface, so you see the surface warming quickly. For a discussion, see:
• Nathan M. Urban and Klaus Keller, Complementary observational constraints on climate sensitivity, Geophysical Research Letters 36 (2009), L04708.
We don’t know precisely what this rate is, since it’s been hard to
monitor the whole ocean over long time periods (and there isn’t exactly a single "rate", either).
This is getting long enough, so I’m going to skip over a discussion of individual feedback estimates. These have been applied to various specific processes, such as water vapor feedback, and involve comparing, say, how the water vapor content of the atmosphere has changed to how the temperature of the atmosphere has changed. I’m also skipping a discussion of paleoclimate estimates of past feedbacks. It follows the usual formula of "compare the estimated forcing to the reconstructed temperature response", but there are complications because the boundary conditions were different (different surface albedo patterns, variations in the Earth’s orbit, or even continental configurations if you go back far enough) and the temperatures can only be indirectly inferred.
JB: Thanks for the summary of these complex issues. Clearly I’ve got my reading cut out for me.
What do you say to people like Lindzen, who say negative feedbacks due to clouds could save the day?
NU: Climate models tend to predict a positive cloud feedback, but it’s certainly possible that the net cloud feedback could be negative. However, Lindzen seems to think it’s so negative that it makes the total climate feedback negative, outweighing all positive feedbacks. That is, he claims a climate sensitivity even lower than the "bare" no-feedback value of 1.2 °C. I think Lindzen’s work has its own problems (there are published responses to his papers with more details). But generally speaking, independent of Lindzen’s specific arguments, I don’t think such a low climate sensitivity is supportable by data. It would be difficult to reproduce the modern instrumental atmospheric and ocean temperature data with such a low sensitivity. And it would be quite difficult to explain the large changes in the Earth’s climate over its geologic history if there were a stabilizing feedback that strong. The feedbacks I’ve mentioned generally act in response to any warming or cooling, not just from the CO2 greenhouse effect, so a strongly negative feedback would tend to prevent the climate from changing much at all.
JB: Yes, ever since the Antarctic froze over about 12 million years ago, it seems the climate has become increasingly "jittery":
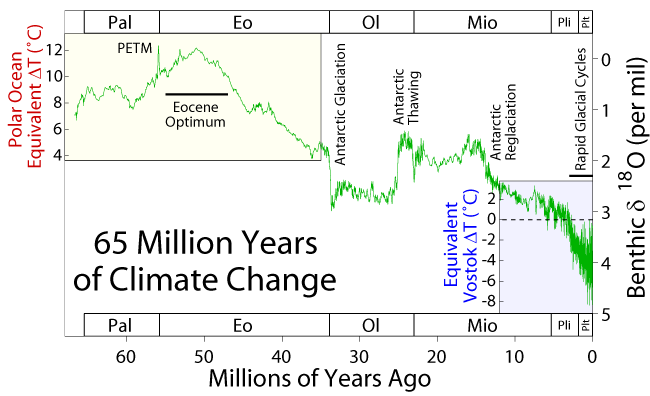
As soon as I saw the incredibly jagged curve at the right end of this graph, I couldn’t help but think that some positive feedback is making it easy for the Earth to flip-flop between warmer and colder states. But then I wondered what "tamed" this positive feedback and kept the temperature between certain limits. I guess that the negative Planck feedback must be involved.
NU: You have to be careful: in the figure you cite, the resolution of the data decreases as you go back in time, so you can’t see all of the variability that could have been present. A lot of the high frequency variability (< 100 ky) is averaged out, so the more recent glacial-interglacial oscillations in temperature would not have been easily visible in the earlier data if they had occurred back then.
That being said, there has been a real change in variability over the time span of that graph. As the climate cooled from a "greenhouse" to an "icehouse" over the Cenozoic era, the glacial-interglacial cycles were able to start. These big swings in climate are a result of ice albedo feedback, when large continental ice sheets form and disintegrate, and weren’t present in earlier greenhouse climates. Also, as you can see from the last 5 million years:

the glacial-interglacial cycles themselves have gotten bigger over time (and the dominant period changed from 41 to 100 ky).
As a side note, the observation that glacial cycles didn’t occur in hot climates highlights the fact that climate sensitivity can be state-dependent. The ice albedo feedback, for example, vanishes when there is no ice. This is a subtle point when using paleoclimate data to constrain the climate sensitivity, because the sensitivity at earlier times might not be the same as the sensitivity now. Of course, they are related to each other, and you can make inferences about one from the other with additional physical reasoning. I do stand by my previous remarks: I don’t think you can explain past climate if the (modern) sensitivity is below 1 °C.
JB: I have one more question about feedbacks. It seems that during the last few glacial cycles, there’s sometimes a rise in
temperature before a rise in CO2 levels. I’ve heard people offer this explanation: warming oceans release CO2. Could that be another important feedback?
NU: Temperature affects both land and ocean carbon sinks, so it is another climate feedback (warming changes the amount of CO2 remaining in the atmosphere, which then changes temperature). The ocean is a very large repository of carbon, and both absorbs CO2 from, and emits CO2 to, the atmosphere. Temperature influences the balance between absorption and emission. One obvious influence is through the "solubility pump": CO2 dissolves less readily in warmer water, so as temperatures rise, the ocean can absorb carbon from the atmosphere less effectively. This is related to Henry’s law in chemistry.
JB: Henry’s law? Hmm, let me look up the Wikipedia article on Henry’s law. Okay, it basically just says that at any fixed temperature, the amount of carbon dioxide that’ll dissolve in water is proportional to the amount of carbon dioxide in the air. But what really matters for us is that when it gets warmer, this constant of proportionality goes down, so the water holds less CO2. Like you said.
NU: But this is not the only process going on. Surface warming leads to more stratification of the upper ocean layers and can reduce the vertical mixing of surface waters into the depths. This is important to the carbon cycle because some of the dissolved CO2 which is in the surface layers can return to the atmosphere, as part of an equilibrium exchange cycle. However, some of that carbon is also transported to deep water, where it can no longer exchange with the atmosphere, and can be sequestered there for a long time (about a millennium). If you reduce the rate at which carbon is mixed downward, so that relatively more carbon accumulates in the surface layers, you reduce the immediate ability of the ocean to store atmospheric CO2 in its depths. This is another potential feedback.
Another important process, which is more of a pure carbon cycle feedback than a climate feedback, is carbonate buffering chemistry. The straight Henry’s law calculation doesn’t tell the whole story of how carbon ends up in the ocean, because there are chemical reactions going on. CO2 reacts with carbonate ions and seawater to produce bicarbonate ions. Most of the dissolved carbon in the surface waters (about 90%) exists as bicarbonate; only about 0.5% is dissolved CO2, and the rest is carbonate. This "bicarbonate buffer" greatly enhances the ability of the ocean to absorb CO2 from the atmosphere beyond what simple thermodynamic arguments alone would suggest. A keyword here is the "Revelle factor", which is the relative ratio of CO2 to total carbon in the ocean. (A Revelle factor of 10, which is about the ocean average, means that a 10% increase in CO2 leads to a 1% increase in dissolved inorganic carbon.)
As more CO2 is added to the ocean, chemical reactions consume carbonate and produce hydrogen ions, leading to ocean acidification. You have already discussed this on your blog. In addition to acidification, the chemical buffering effect is lessened (the Revelle factor increased) when there are fewer carbonate ions available to participate in reactions. This weakens the ocean carbon sink. This is a feedback, but it is a purely carbon cycle feedback rather than a climate feedback, since only carbonate chemistry is involved. There can also be an indirect climate feedback, if climate change alters the spatial distribution of the Revelle factor in the ocean by changing the ocean’s circulation.
For more on this, try Section 7.3.4 of the IPCC AR4 WG1 report and Sections 8.3 and 10.2 of:
• J. L. Sarmiento and N. Gruber, Ocean Biogeochemical Dynamics, Princeton U. Press, Princeton, 2006.
JB: I’m also curious about other feedbacks. For example, I’ve heard that methane is an even more potent greenhouse gas than CO2, though it doesn’t hang around as long. And I’ve heard that another big positive feedback mechanism might be the release of methane from melting permafrost. Or maybe even from "methane clathrates" down at the bottom of the ocean! There’s a vast amount of methane down there, locked in cage-shaped ice crystals. As the ocean warms, some of this could be released. Some people even worry that this effect could cause a "tipping point" in the Earth’s climate. But I won’t force you to tell me your opinions on this — you’ve done enough for one week.
Instead, I just want to make a silly remark about hypothetical situations where there’s so much positive feedback that it completely cancels the Planck feedback. You see, as a mathematician, I couldn’t help wondering about this formula:
T = -F/(λ0+λ)
The Planck feedback λ0 is negative. The sum of all the other feedbacks, namely λ, is positive. So what if they add up to zero? Then we’re be dividing by zero! When I last checked, that was a no-no.
Here’s my guess. If λ0+λ becomes zero, the climate loses its stability: it can drift freely. A slight tap can push it arbitrarily far, like a ball rolling on a flat table.
And if λ were actually big enough to make λ0+λ positive, the climate would be downright unstable, like a ball perched on top of a hill!
But all this is only in some linear approximation. In reality, a hot object radiates power proportional to the fourth power of its temperature. So even if the Earth’s climate is unstable in some linear approximation, the Planck feedback due to radiation will eventually step in and keep the Earth from heating up, or cooling down, indefinitely.
NU: Yes, we do have to be careful to remember that the formula above is obtained from a linear feedback analysis. For a discussion of climate sensitivity in a nonlinear analysis to second order, see:
• I. Zaliapin and M. Ghil, Another look at climate sensitivity,
Nonlinear Processes in Geophysics 16 (2010), 113-122.
JB: Hmm, there’s some nice catastrophe theory in there — I see a fold catastrophe in Figure 5, which gives a "tipping point".
Okay. Thanks for everything, and we’ll continue next week!
The significant problems we have cannot be solved at the same level of thinking with which we created them. – Albert Einstein


I would think the a priori assumption has to be that climate feedback is negative not positive.
Otherwise, how can you explain that global climate seems quite stable over hundreds of years?
This is addressed up in the section talking about Planck feedbacks. It’s mostly a semantic issue due to how climate scientists have historically used (or misused) feedback terminology.
When climate scientists talk about feedbacks, they’re often talking about “everything except for the Planck feedback” (which is negative). In general, “positive feedback” is often used as a synonym for “gain greater than unity” (i.e., an amplifying feedback). You can have a feedback which is amplifying, yet stable. (That is, the temperature change you get in response to a forcing is larger than what you’d get without the feedback, but it’s still a finite change.)
The review paper by Roe might be helpful here to understand the language of climate feedbacks; also the paper by Bates. Control system engineers may feel free to scoff at the climate science feedback conventions (there is a notable paper cited by Roe which even gets them backward), and I’m sure other commenters can hash out the details.
By the way, a note to other commenters: I’m away at a workshop right now and may not have time to address all questions people may have, so don’t be offended if I’m selective or unresponsive in replying.
Possibly you weren’t thinking of the “unstable feedback” argument (which is what I usually hear in response to any mention of positive feedbacks). Maybe you were just asking whether an amplifying, but stable feedback is compatible with the temperature fluctuations over the last few centuries. The answer is yes, as far as we know, because the climate has not been very strongly forced over that time, so you don’t expect a very large response even with an amplifying feedback. Climate sensitivities within the IPCC range (which are all amplifying, although some weakly so) work reasonably well to capture that time period. But this depends on our knowledge of past forcings. If they turn out to have been larger than we think, then that would favor a weaker climate sensitivity. (And vice versa if they were smaller than we think.)
Nathan,
since you know quite a bit about this, let me use this opportunity to ask a question about the auto-correlation function of the global temperature record if you don’t mind. How does the auto-correlation function look like and do the best climate models match the measured correlation coefficients?
You can fit the detrended instrumental surface temperature record pretty well with a fairly low order process, like ARMA(1,1) or even, to an extent, AR(1). (I use the latter for the autocorrelation of the residuals between the observations and simple energy balance models. That’s not quite correct, but it captures the first order influence of red noise on inferences.)
There has been work looking at this spectrum in more detail, and comparing it to GCMs, but most of it is a bit old by now (10-15 years?) and I’m not totally familiar with it. For model output you might start with Manabe and Stouffer (1996) and work your way forward to more modern papers.
Wolfgang wrote:
Indeed if you including the Planck feedback λ0, the total feedback λ+λ0 is negative!
Your question makes me wonder if you read this part of “week302”:
If you read further, you’ll see an estimate for the total feedback, including Planck feedback, and it is indeed negative.
John wrote:
My point was that those limits seem to be quite narrow over several hundred years.
They should be narrow if you don’t force the system much.
Okay, Wolfgang, I think the remark of mine that you quote here was confusing — stupid, basically — so I’ll fix it. Here’s the deal. In most of our conversation Nathan and I were assuming that the Earth is in stable equilibrium thanks to the total feedback being negative. This allows the use of the linear approximation that we were talking about:
T = -F/(λ+λ0)
Here the total feedback λ+λ0 is negative, thanks to the negative Planck feedback λ. But you can also imagine a situation where the other feedbacks λ are not only positive but so large that they overwhelm the Planck feedback. Then what happens? Then the climate is unstable… but the temperature will still not rise to infinity or drop to zero, as a naive linearized treatment would suggest!
For example, if the temperature keeps rising, you need to remember that the radiation emitted grows as the fourth power of the temperature — and so, the Planck feedback eventually wins, even if it’s not big enough to win in the linearized treatment.
When I said “nothing very comfortable” I was thinking about the runaway greenhouse effect that could occur if it got hot enough to evaporate the oceans and form really thick clouds — the relevant buzzword here is “Kombayashi-Ingersoll limit”. Something similar happened on Venus and, barring human intervention, something like this could eventually happen on Earth as the Sun gradually expands into a red giant. (In fact, the Andromeda nebula is scheduled to collide with the Milky Way before that happens, but never mind.)
You can imagine how it goes: as it gets warmer and warmer, the positive feedback due to water vapor becomes more and more significant, and eventually it overwhelms the Planck feedback — in a linearized treatment of the problem. So, we hit a “tipping point” and get a runaway greenhouse effect. The oceans completely evaporate. But the temperature doesn’t rise to infinity. It’s confined within some limits. Certainly nothing very comfortable — but some limits!
But this is not relevant to the last few hundred years, and it was confusing for me to have summarized such a long train of thought in such a sketchy way. I should have stuck to the linearized picture until later, where we talked a little about nonlinear aspects of feedback.
Actually i didn’t think that the part where he explains the feedback and the formula to calculate the temperature was that great. I mean, it was very interesting and informative, but seemed (to me) to rely on some unwritten things, that were mentioned only later.
The way i see it, we are just implicitly assuming a simple linear model of the form:
where is a time constant that regulates how fast the system responds (that is if the CO2 doubles right now, how long would it take for the temperature to rise above a certain level), and
  the deviation from the original temperature.
If is less than 0, the system is stable, which means that when
  changes after a transition then we get to conditions in which
  . In these new conditions we have
which explains the formula for the temperature.
As you said, if you solve the equation when is greater than 0 you see that
  just runs away, so
  is indeed a tipping point.
I mean, don’t get me wrong, it’s all excellent stuff, but perhaps stating that equation clearly (if i indeed got it right) could help people understand where the formula comes from.
So if the CO2 doubles we very roughly have:
giving a T=3.3 after some time (months, years…?)
One thing that is not clear to me is whether we are assuming that the aerosol is kept constant, and that the feedbacks due to ocean CO2 sequestration is considered very small so it’s not included. Also, just out of curiosity, can we educatedly guess the feedback number from released methane in permafrost? Or would be better to treat it like another forcing term that suddenly switches on at some point?
Yes, I’m implicitly using such a linearized equation. But John just asked me what the main feedbacks are, not to rederive linear feedback analysis from first principle blackbody thermodynamics. That’s what the links are for (e.g., to the Roe paper, although note it uses a different convention). I just wanted to give enough math to convert the numbers I was quoting into numbers people care about.
Feedback analysis always takes place with respect to some reference system, and in this case (the Soden and Held analysis) the carbon cycle component of the system was held fixed, so there are no extra feedbacks there. The carbon cycle feedbacks are not necessarily small, however, especially in the future over century time scales.
Models do have aerosol-cloud interactions in them, but I’m not sure what the models in that paper did. I’d have to go back and read it more carefully. The feedback analysis should at least take into account the direct radiative effect of aerosols, but perhaps not the indirect aerosol-cloud feedbacks.
Methane feedbacks are very uncertain. There has also been some discussion as to how to treat carbon cycle feedbacks (as part of the climate feedback, or the forcing). One relevant paper is by my collaborator Damon Matthews, The proportionality of global warming to cumulative carbon emissions, which prefers to focus on a “carbon-climate response” rather than individual climate and carbon feedback factors.
Giampiero wrote:
Since you can use HTML in your comments, you have to avoid the character <, since this character marks the beginning of an HTML command. To get the character <, you have to type
<
which is the HTML character entity reference for the symbol <.
This is a bit annoying when typing mathematics, but the ability to use HTML is great. If you know TeX, you can also use TeX to write equations here, as long as you remember to enclose your equations with
$latex $
instead of the usual
$ $
I’ve tried to fix your comments so they make sense to me.
Sometime I may write a This Week’s Finds where I talk about various different climate models, starting from the very simplest ones. I wasn’t thinking about differential equations when I asked Nathan about climate feedbacks ‐ but after he wrote down the magic formula
T = -F/(λ+λ0)
I started wondering what happened when λ+λ0 = 0. This made me start pondering the physical model that must underlie this equation. Thanks for making it explicit!
(My “rolling ball” metaphor was a bit misleading, since it suggests a 2nd-order differential equation, while a 1st-order differential equation is what we want. But a rolling ball in an extremely viscous fluid can be modelled using a 1st-order ODE: we can say its velocity is proportional to the applied force.)
When life is linear, life is easy. Unfortunately it hardly ever is. But everything is linear to first order.
There must be feedbacks on CO2 itself, not necessarily temperature related. A temperature related one is that trees grow closer to the North Pole, absorbing some CO2. A non-temperature related one is that plants don’t have to open their pores so much to let CO2 in, so they don’t lose so much moisture, so they can grow in drier areas. The more general question is why the CO2 level is normally pretty stable, despite geological processes pushing in both directions. You’d think this must be because there is some sort of stable equilibrium. Of course we might have pushed CO2 outside the region in which the stable equilibrium applies.
I also wonder whether it is true that higher temperatures necessarily reduce the amount of snow. There is more moisture in the air (as mentioned) and when it falls it will often fall as snow. I particularly wonder what would happen if there was much more open water in the Arctic Ocean. It seems at least possible that more snow would fall on the surrounding lands.
The “ball rolling on a flat table” rings my bell. If we imagine a non flat table, and the ball is in a depression with feedbacks all around pushing it back into the depression. Now we push it in one direction which we might call “warm”. Why are we so confident that once it gets outside the depression it will keep going in the “warm” direction? To be more explicit: in the last interglacial it was warmer than this one, and the sea level rose steadily throughout. Then the temperature must have fallen dramatically because the sea level falls at about 1cm a year for 7000 years, starting quite abruptly (based on a diagram from Dr Church’s talk at GreenHouse 2007, which isn’t on the web any more). One cm of sea level fall is a lot of ice building up somewhere. Are we really confident Milankovitch explains this?
Robert wrote:
When you say “the ball gets outside the depression” you are talking (metaphorically) about the climate reaching and passing a “tipping point”. For a simplified mathematical treatment — which is probably not what you’re interested in — I highly recommend Nathan’s last reference:
• I. Zaliapin and M. Ghil, Another look at climate sensitivity, Nonlinear Processes in Geophysics 16 (2010), 113-122.
and particularly Figure 5, which shows a tipping point scenario where cooling the Earth makes it tip from its current state to a much colder one — a bit like in the Snowball Earth hypothesis. Or, conversely, a scenario where warming the Snowball Earth makes it tip back to its current state.
I know this isn’t what you were asking about — I just think everyone should read this paper, because it’s interesting.
I think your actual question is: how confident are we about the Milankovitch cycle explanation of the Ice Ages? I would definitely enjoy immersing myself in all the puzzles surrounding this question… but preferably with the help of some experts.
Yes, there are feedbacks on CO2, such as the stomatal CO2 fertilization effect you mention, or the Revelle factor change I mentioned.
Also, as you say, higher temperatures do not necessarily reduce the amount of snow – it is a balance between temperature and precipitation changes which has to be worked out in detail to find the sign. I don’t know a lot about that area but there is certainly a literature on projected snowfall changes and their causes.
As for the glacial-interglacial cycle, there are still important questions about causes. It is pretty well accepted that Milankovitch forcing is a strong influence on the glacial-interglacial cycle, but nonlinearities (e.g., in climate-ice dynamics) and stochastic variability in the system also play a role in explaining why all the glacial and interglacial periods don’t look the same.
One very minor point about stochastic variability and data-model comparison. Jitter noise as in time series data should always be unmodeled (as can be proven by simply resampling at slightly different time points). Usually the best jitter filter is the 5 point trapezoid weighted (1 2 2 2 1). This filter is somewhat famous in climate change statistics, associated with analyses of monthly sunspot numbers etc.
Disclaimer: I’m not a climate expert, I’m more of general modelling/machine learning type guy.
I’d have thought that whilst one should use model fitting techniques which avoid fitting to the noise, running an averaging filter over the data is only one way of doing it, and not necessarily the best in all cases. (For instance, an averaging filter is going to limit the resolution achievable by a change-point estimator.)
Unfortunately in modeling data as complex systems dynamics with nonlinear feedback, some of the noise inevitably gets modeled. This is a feature, not a bug, since you can get complex behavior including large excursions, temporary stability, etc with just a few parameters.
However modeling data with jitter noise, high frequency up-and-down “grass” on a time series graph, should always be done cautiously because it affects sensitivity analyses as well as values of parameters. *Usually* the best way to deal with jitter noise is the specific averaging filter I mentioned (not any other!).
What’s a “change-point estimator”?
(Hmm, I have a guess — and of course I could look it up, but while Google renders many conversations unnecessary, I’m not gonna stop talking.)
The idea is simple: suppose you’ve got some time series data that you think is represented by one set of unknown model parameters (one example is mean and variance, although it might be different parameters) at up to time
  and then by a different set of unknown model parameters afterwards, estimate that time
  . (Note that this is trivial when the noise is much less than the change in mean, much more difficult when the noise is greater than the change in mean.) It’s a basic process for spotting when some underlying condition has changed. One use is, for example, looking at if hurricane occurrence has changed over time, e.g., this paper.
The meta-point was that averaging filters are one way to attempt to reduce the influence of jitter noise in an analysis, not necessarily the most appropriate in all circumstances, particularly if you’re using a fitting/comparison method that is designed to be robust to jitter. (The primary “issue” is that it’s easy to over-smooth the data without noticing.)
Thanks, bane — it makes perfect sense to me now.
What you mean by “jitter”? I see this term has a technical definition as “the deviation in or displacement of some aspect of the pulses in a high-frequency digital signal”, or “the period frequency displacement of the signal from its ideal location” — or in words a 3rd-grader can understand, “shaky pulses”. But I’m guessing you’re using it to mean high-frequency noise in a time series.
No complaints — just trying to learn. I am very ignorant of noise and filters but they seem like fascinating topics. It seems there are some tricky questions about what counts as the “best” filter, since from a Bayesian perspective the “goodness” of a filter depends on some prior assumptions about either what the true signal should look like, or what the noise is like. Is your preference for the 5 point filter (1 2 2 2 1) mainly a matter of practical experience or is there also a big theory of this stuff?
Another question (don’t feel you need to answer them all): what does it mean to “unmodel” jitter noise? Just to filter it out, or something else?
From a Bayesian perspective it’s hard to get away from modeling your noise structure, since Bayesian inference requires a likelihood function, which is nothing other than an explicit model of your stochastic data-generating process.
Occasionally I will do simple binning (e.g., annual averages), mostly just to reduce the dimensionality of the data. Filtering can be thought of as a fancier version of that. But one should be wary, because you’re not working with real data anymore, and you have to worry what that does to your inference (since your “data” doesn’t actually arise from your data-generating process unless you put a model of your smoothing filter into your likelihood).
For the most part, I do try to model the data-model residuals (this includes both “natural variability”, measurement error, and model structural error), and usually use simple parameterized time series and spatial models to do so (e.g. correlated Gaussian processes).
Jitter is essentially unmodelable Nyquist frequency or aliased noise in discretely sampled data. It always is a bad component of undersampled data, meaning either that the sampling should have been done quicker or with more stable instrumentation (where the term comes from).
Suppose you are going to estimate model structures in data, such as a peak. Jitter should never ever be parameterized as part of the structure. Often people “model” jitter *separately*, e.g. additive Gaussian noise, but by definition residuals are the unmodeled part of the data.
It turns out in practice that spectrally filtering is never the best way to deal with jitter, if the noise is indeed jitter. Always it is better to use time domain methods, and specifically the window I mentioned. Of course it would be best to have oversampled (like much real climate data is – many data points for centuries long waveforms – what looks like jitter often isn’t jitter on closer inpection).
Going back to estimating the location of a peak. Clearly you want data in the peak to be higher than on either side. One point on either side does not a trend make, especially with noise. But two on either side – now we’re talking five points.
Great. Thanks. This is what I hoped of this blog. (But it’s not free of disappointment… Leave polit garbage like Lomborg to Toles who, like me, hopes to never type his name again.)
Readers interested in feedbacks and the Zaliapin and M. Ghil reference might find my web link handy.
http://chriscolose.wordpress.com/2010/08/23/climate-feedbacks-part-1/ and the section talking about how similar solar+greenhouse parameters can lead to drastically different climates depending on the path it took to get there.
I’m holding off a bit for part 2, I want to progress toward a more technical explanation of feedbacks.
Hi, Chris! Your blog is great. I enjoyed part 1 of your climate feedback series and had considered linking to it in “week302”, but decided I should let Nathan run the show.
Until part 2 comes out, beginners can read part 1, read what Nathan said in my interview, and have fun pondering this puzzle. Chris wrote:
Puzzle: what calculation is done to obtain this result?
(It’s not complicated.)
Chris,
I liked your blog post too, but I didn’t think to mention it in the interview. Sorry! I’m used to thinking in terms of literature citations, but for a web interview I should also think about web references (as John often posts).
It’s not correct to say that CO2 is in a stable equilibrium, although of course there are constraints on how much it can change. Bear in mind that low-CO2 induced cold periods like the Pleistocene are quite rare subsequent to the end of the last snowball episode ~600 mya. Basically we owe the present cold climate state to a combination of low volcanic outgassing relative to sequestration (of CO2). This recent not-too-technical presentation by Richard Alley sums up CO2’s role in that history.
Also, to disagree a little with a point Nathan made, I think a lot of scientists consider the mid-Pliocene (only ~3.3 mya) to be sufficiently similar to present planetary conditions as to constitute a helpful guide to potential future conditions. We’re talking some major changes as a consequence of current CO2 levels (*if* they stay in place long enough), to say nothing of the 500+ ppm we seem to be headed toward. Here’s a recent paper focused on the Arctic, where the largest changes are expected.
I should add the the analogy breaks down somewhat since rather than a slow, smooth rise in CO2 with plenty of time for the climate system to adjust, what we’re doing is applying a short, sharp shock that will result in transient conditions for which the mid-Pliocene or prior equilibrium climate states with higher CO2 and temperatures are less than ideal guides. As Wally Broecker say, it’s an angry beast and we’re poking it with a stick.
I should clarify that the first sentence refers to something Robert Smart said above.
Steve wrote:
Is that universally accepted these days? When I last checked, a while ago, two popular theories involved 1) the “thermal isolation hypothesis”: the separation of Antarctica from Australia allows cold water to circle endlessly around Antarctica, leading to glaciation and a bigger ice albedo, and 2) the rise of the Tibetan plateau as India smacked into Asia.
Here’s something relevant:
• Robert M. DeConto and David Pollard, Rapid Cenozoic glaciation of Antarctica induced by declining atmospheric CO2, Nature 421 (January 16 2003), 245-249.
I haven’t re-read that paper lately, but I think just the title makes it clear that the CO2 draw-down was precedent to the Antarctic glaciation. Much detail has been added since; see e.g. the paleo discussion in Hansen et al.’s Target CO2. IIRC that draw-down may have been a matter not so much of the formation of the Tibetan plateau as India having stopped plowing up carbonate-rich seafloor. The later isolation of Antarctica probably allowed deeper glaciation, and even later was a necessary factor in the Plio-Pleistocene glacial cycles since the speed-up/slow-down of the Antarctic Circumpolar Current is how the amplifying CO2 gets in and out of the deep ocean. IMHO all of this supports the idea that the happenstance of plate tectonics is at the root of things.
All of that said, I feel a little out of place engaging in this sort of exposition when Nathan and Chris are participating.
Thanks, Steve!
We shouldn’t make the bigshots do all the work.
Seriously, I’ve helped moderate discussions like this since before the web was invented, and one thing I’ve noted is that after the not-quite-experts do their best to explain things, the experts are often happy to step in and fine-tune the details. And it’s often easier to for the amateurs to understand the experts after hearing what the not-quite-experts have to say. The experts can be hard to understand without a bit of warmup.
JB said:
There is a word for this phenomenon in German, but I did not find a proper translation: “betriebsblind”.
Meaning: You become unaware of the amount and level of explanation that people need who do not do the work that you do every day.
There are several very good examples of this phenomenon in this thread, like:
There are ways to handle this problem, like this one:
This may be unfamiliar to mathematians and physicists who were and are very creative and successful by working hard on their own and presenting the results to the experts…
I’m not an expert on Cenozoic climate either. (I suppose I should have talked to Dave Pollard more about that when I was at Penn State; that’s where he’s aiming most of his future research.) But the feeling I got is that both processes are important: CO2 drawdown, and the development of the Antarctic circumpolar current and influence on the polar vortex. (I’ve mostly heard about the Drake Passage opening – separation of South America from Antarctica – but the opening of the Tasmanian Gateway must be similar.)
So the present (perhaps just-past) glacial conditions owe their existence first to the low rate of outgassing in the presence of high sequestration capacity, the presence of an isolated continent at one pole and a semi-landlocked ocean at the other, and an ocean corridor (the Atlantic)providing a means for them to interact, with CO2 levels barely low enough to allow this geographic combination to produce major glaciations. What were the odds? No wonder glacial states are rare in the Phanerozoic.
Just to note a few more recent papers relating to Cenozoic glaciation, given the vast progress of the last seven years (all public copies):
Pagani, M., Liu , Z., LaRiviera, J., Ravelo, A. C. (2009) High climate sensitivity to atmospheric carbon dioxide for the past 5 million years, Nature Geoscience, 3, 27-30.
Liu, Z., Pagani, M., Zinniker, D., DeConto, R., Huber, M., Brinkhuis, H., Shah, S., Leckie, M., and Pearson, A. (2009) Global cooling during the Eocene-Oligocene climate transition, Science, 323, 1187-1190.
DeConto, R. M., Pollard, D., Wilson, P.A., Pälike, H., Lear, C. H., Pagani, M., (2008) Thresholds for Cenozoic bipolar glaciation, Nature, 455, 652-656.
And the Hansen paper, which I mentioned before but didn’t link:
Hansen, J., Sato, M., Kharecha, P., Beerling, D., Berner, R., Masson-Delmotte, V., Pagani, M., Raymo, M., Royer, D., Zachos. J.C., (2008) Target atmospheric CO2: Where should humanity aim? The Open Atmospheric Science Journal, 2, 217-231.
I second the recommendation of Alley’s talk. (Unfortunately I missed it when I was at AGU.) He really needs to write that up into a review article.
I don’t really disagree that the mid-Pliocene can be an analogue for future climate impacts, so I’m not sure what you are disagreeing with. Perhaps I worded something poorly.
I am cautious about attributing all the differences between that time and the present to CO2 (i.e., arguments of the form “if we reproduce Pliocene CO2 levels, we will reproduce the Pliocene climate”). But I do think, for example, that the Pliocene can tell us things about, say, the sensitivity of sea level to global warming.
Steve wrote:
Is this a universal or majority opinion of climate scientists? I ask because I asked a similar question about 10 years ago in a forum that included some climate scientists, and I believe others were consulted on the question. Their reply didn’t make your point, at least not as clearly (I didn’t entirely understand the response).
CO2, like temperature, is never strictly in equilibrium. The equilibrium assumption depends on space and time scale. If you look at diurnal fluxes near the surface, those can be quite large. If you looked at the main “well mixed” component, that’s more stable, but fluctuates by a few ppm on a seasonal time scale. Over the Holocene (last 10,000 years or so) there have been somewhat larger variations (~10 ppm?), and between glacial-interglacial cycles there a large dynamical signal on the order of 100 ppm.
Anyway, I think the main timescale of relevance is the Holocene, and CO2 has been pretty stable over that time. So has temperature. But we are perturbing both the climate and carbon cycle systems in unusual ways.
By adding a new source of carbon, we not only change the temperature and potentially start seeing more influence of temperature feedbacks on the carbon cycle (e.g., temperature sensitivity of heterotrophic respiration), but we can see feedbacks on the carbon cycle directly resulting from a large CO2 perturbation (such as carbonate chemistry). And I’m not even getting into methane “tipping points”.
I think the bottom line is that despite Holocene CO2 stability, we can’t necessarily assume that the stability will remain constant.
When I say “stable equilibrium” I just mean that a small change in any direction (in the CO2 level) generates changes that push the CO2 level back towards the previous level. This doesn’t guarantee any sort of equilibrium when you get away from small changes. But still it would be nice to understand that now lost Holocene stable equilibrium.
It is true that the CO2 sinks will eventually remove any excess and return things to the base level. This is not for the most part a feedback process (i.e. there’s little or no pushing back involved) since the rise in CO2 doesn’t create added capacity in the sinks. Added plant growth due to CO2 fertilization would be an exception, but IIRC that’s a minor sequestration pathway.
The presence of excess sequestration capacity does raise the question of why CO2 levels ever stopped dropping. This recent paper provides an answer.
Well, I suspect this is a matter of talking about different time scales, since in a short-term sense (the ~10 ky of the current Holocene interglacial) it was quite stable until we got involved, and longer term one could say that CO2 levels of the last six glacial cycles were stable since they cycled fairly consistently between ~180 and ~300 ppm, but over the very long term there’s no obvious stability (as Richard Alley describes in the linked video). Snowball CO2 might have been under 100 ppm and at other times it may have gone as high as 3000 ppm.
I don’t think any of this is controversial, although probably some of it was more so ten years ago since a lot less was known, but even then I don’t think it would have been reasonable to make an argument for long-term stability.
Maybe before talking about “feedbacks”, one probably should begin from what the “forcings” are? Especially the ones from “well mixed greenhouse gases”… And what kind of observational evidence is in support of these “estimated” amplitudes of radiative forcings, say the 4+-0.3 W/m2 from CO2 doubling?
Interesting interview but it does little to settle the questions in the introduction. The crucial problem is the reliability of the models:
NU: “To estimate the total feedback, you first estimate the radiative forcing of the system, based on historic data on greenhouse gases, volcanic and industrial aerosols, black carbon (soot), solar activity, and other factors which can change the Earth’s radiative balance. Then you predict how much warming you should get from that forcing using a climate model, and tune the model’s feedback until it matches the observed warming. The tuned feedback factor is your observational estimate.”
But what proof is there that those models are correct?
One should never trust a model without first seeing that it correctly predicts experimental outcomes in multiple runs and in a wide variety of experimental conditions.
It is especially important when we are talking about something as complex as global climate and when the stakes are as high as the future of the global economy.
Unfortunately doing experiments on global climate is next to impossible so there is very little experimental data with which to test the models.
What is even more unsettling is that the models cannot even correctly reproduce what little data there is. So far not a single climate model passed the most obvious check one can think of – explaining climate variation of the past century. How can anyone trust models which cannot postdict the known past climate to correctly predict the unknown future climate?
Another problem is that according to this article current models cannot even correctly account for the energy budget of the planet – *half* of the expected extra heat from greenhouse effect is missing!
But what is most interesting is that apparently the possibility that it’s the models that are wrong here is not even mentioned.
http://www.nytimes.com/cwire/2010/04/16/16climatewire-the-difficulty-of-balancing-earths-energy-bu-62508.html
Experiment is the very foundation of the scientific method, it is the sole source of the success of science. As a consequence the reliability of each scientific discipline is directly proportional to the ease of performing and interpreting experiments in it. This is the reason fields like classical physics, chemistry or molecular biology are much more reliable then psychology, sociology or economy.
Unfortunately climatology is clearly in the second group.
Re that NYT article, I notice that it didn’t even mention models, probably because the problem lies with observations. Note that there’s no question that the climate system is retaining the heat. FYI the subtext is that the authors are complaining about the lack of deployed observing technology.
Re the role of models generally, you’re overstating things greatly. As Jim Hansen says, the case for the problem is made using paleoclimate, modern observations and only then models, and indeed the first two are sufficient for the purpose. The models are useful first for giving us an idea of how fast the climate is likely to change, and second for figuring out regional effects.
The article we are commenting on clearly states that models are required for estimation of feedbacks and without knowing the feedback we won’t have any idea where the climate will go, I even quoted the relevant part.
But from what you wrote I get the impression that you also misunderstand the role models play in science – any consistent scientific description of something is a model, if we have no reliable climate model we cannot say anything reliable about the climate! So to say that a model is not needed to make a case for anthropogenic global warming (or anything else) is absurd.
You say: “As Jim Hansen says, the case for the problem is made using paleoclimate, modern observations and only then models, and indeed the first two are sufficient for the purpose.”
But both paleoclimate and modern observations are *data*, without a model which makes sense of that data you cannot make any argument or prediction! Numbers themselves don’t make any predictions! To predict anything you need to identify patterns in the data and then extrapolate those patterns into the future, and those patterns are nothing else then the scientific models.
The obvious problem is that the same data can support many different models so normally you keep doing experiments and collecting more data to check against candidate model until you either rule it out or show that the model makes correct predictions in so many different situations that the chance of the agreement with data being a fluke is negligible.
The problem I am talking about is that in climatology there is very little data to begin with and no good way to get more, there is fragmentary paleoclimate data (subject to interpretative problems) and there is incredibly short instrumental record and that’s it. The only way to get more data is to wait. That’s why the climate models we have cannot be considered reliable – there is not enough data to test them on, and it still remains to be proven that they can make correct predictions.
And without verified, reliable climate models we cannot claim that we understanding global climate or that we can predict where it will go next. We can only offer various hypothesis, anthropogenic global warming is just one such hypothesis, which while plausible remains far from proven.
Oddly, a search of the page for “model” doesn’t turn up anything. You want them to be saying something they’re not saying.
Otherwise, I would say you just demonstrated pretty comprehensively that you’re familiarized yourself with the science only so far as you think necessary to construct a coherent-sounding (to you) argument against it. As John wants us to be constructive here, I’ll suggest that for a start you read over the various paleo papers that have been linked on the thread, but otherwise I’ll drop the discussion.
Arrow wrote:
The “article” Arrow is talking about is presumably week302.
Steve wrote:
The “page” Steve is talking about is presumably the New York Times article cited earlier by Arrow.
It seems you are talking at cross purposes.
There is one characterization of earth’s heat transfer that has left me scratching my head. It goes like this: The earth’s ocean absorbs heat better than the air can, so most of the absorbed heat goes into the ocean. Also the bottom of the ocean is still pretty cold because heat goes down slowly through the ocean layers. Then there is a statement that says if the earth’s CO2 level was suddenly reduced to 1960 level, then air temperature would still go up for a while instead of dropping because the ocean is ‘lagging’. This is the part that I do not follow.
Why does not lower CO2 level imply lower temperature? I guess I often see this theme in newspaper reports stating that even if CO2 level stabilized, the temperature will keep rising. Do we have some unstated delayed positive forcing going on?
The lag is because of the heat capacity i.e. mass. Even seasonally remember higher temperatures in August are due to extra flux in June and July.
I know heat only flows from hot place to cold place. How can an ocean at 60 degrees F cause an August noon time temperature of 100 degrees F?
If the ground was cool in the morning, how does it remember that it was hot two months ago?
There should be a way to compose the elements to make things make more sense to the regular people on the street.
In the first instance the atmosphere would be heated by insolation and losing heat to the cooler ocean. A key point is that as the ocean warms the atmosphere will as well since it has less of a heat sink to work with.
Re the ground, it’s a minor factor since it gains and loses heat very slowly. Note that profiles taken from boreholes do record temperature chnages, so the ground has been shown to “remember.”
On your last point, it’s a struggle since among other things a large proportion of people seem to have a hard time grasping accumulation, especially when it’s multi-factorial, which makes it hard for them to understand climate. In the face of that, it probably makes the most sense to try to convince that part of the public to take scientists’ word for it, which of course is why we see the fossil fuel industry putting so much effort into attacking scientific credibility.
Nathan, thanks for the answer. John, thanks for editing the text and the explanation, i suspected that html marks were the problem but it was already too late :)
If you can, you can delete the sentence in the first post of mine that begins with “So, if \lambda + \lambda_0 is greater” and ends with “tipping point.” and replace it with the content of my second post (which you can then delete). It’s no big deal but perhaps it would probably be less confusing for whoever reads it the first time.
When life is linear, life is easy.
Couldn’t agree more, it would be much easier for example doing a weighted average of the things you want to do instead of having to pick one, but let’s not digress :-)
I edited your first comment and deleted the second one, Giampiero.
Well, the path-integral approach to quantum mechanics says that’s what we actually do — but it doesn’t feel that way, so it doesn’t help much.
This paper may be relevant from the opposite perspective.
Click to access Spencer-Braswell-JGR-2010.pdf
It discusses a new way of estimating climate feedback. It’s only just been published so it’s early days yet on whether it will stand up to the test of public scrutiny. I’m sure there’s much to criticise and develop about it.
It’s not so new, actually. With a little help from Julia Child, Ray Pierrehumbert reviewed a prior version a couple of years ago. Ray didn’t address it since he wanted to critique the paper within its own terms, but then and now Spencer neglected to address the problem of paleoclimate being incompatible with low sensitivity.
Thanks for the reply and the link. When I said ‘new’ I meant within the last few years.
While the current paper does develop ideas mentioned in the earlier work discussed by RealClimate, Pierrehumbert doesn’t say much more than that he doesn’t understand them, and perhaps as a result he doesn’t really answer the point. Spencer claims that they’re mixing up forcing and response, and Pierrehumbert responds by doing exactly that. The new paper concentrates on an aspect of the earlier work that the RealClimate article didn’t mention.
The accuracy of paleoclimate sensitivity estimates is another topic entirely.
Hope springs eternal, NiV.
Speaking of correctly modeling forcing, an interesting new paper ” Long-term Evolution of Sunspot Magnetic Fields”
http://arxiv.org/abs/1009.0784v1
argues that long term and recent trends in observed infrared spectra and magnetic field strengths imply that a tipping point in sunspot activity is currently being reached, right now as it were. If that is correct, and if it is correct that sunspot activity is correlated with solar irradiance (e.g. the Maunder Minimum), then we may be at the start of another Capital Minimum.
One takeaway would be that efforts are misplaced that depend upon making sure that the recent solar cycle normal min-max change of > 1 W/m2 is modeled to 5 more decimal points.
See also data of Fröhlich et al. (especially Figure 5 in their Solar Constant page linked)
http://www.pmodwrc.ch/pmod.php?topic=tsi/composite/SolarConstant
This is dubbed the Planck feedback and has already been mentioned in “week302″ of “This Weeks Finds” here […]
[…] I don’t want to give a tutorial on climate sensitivity here; for that, see my earlier interview on the Azimuth Project and Planet 3.0 blogs. […]
[…] For more discussion go to my blog, Azimuth. […]