guest post by Nadja Kutz
This blog post is based on a thread in the Azimuth Forum.
The current theories about the Sun’s life-time indicate that the Sun will turn into a red giant in about 5 billion years. How and when this process is going to be destructive to the Earth is still debated. Apparently, according to more or less current theories, there has been a quasilinear increase in luminosity. On page 3 of
• K.-P. Schröder and Robert Connon Smith, Distant future of the Sun and Earth revisited, 2008.
we read:
The present Sun is increasing its average luminosity at a rate of 1% in every 110 million years, or 10% over the next billion years.
Unfortunately I feel a bit doubtful about this, in particular after I looked at some irradiation measurements. But let’s recap a bit.
In the Azimuth Forum I asked for information about solar irradiance measurements . Why I was originally interested in how bright the Sun is shining is a longer story, which includes discussions about the global warming potential of methane. For this post I prefer to omit this lengthy historical survey about my original motivations (maybe I’ll come back to this later). Meanwhile there is an also a newer reason why I am interested in solar irradiance measurements, which I want to talk about here.
Strictly speaking I was not only interested in knowing more about how bright the sun is shining, but how bright each of its ‘components’ is shining. That is, I wanted to see spectrally resolved solar irradiance measurements—and in particular, measurements in the range between the wavelengths of roughly 650 and 950 nanometers.
This led me to the the Sorce mission, which is a NASA sponsored satellite mission, whose website is located at the University of Colorado. The website very nicely provides an interactive interface including a fairly clear and intuitive LISIRD interactive app with which the spectral measurements of the Sun can be studied.
As a side remark I should mention that this NASA mission belongs to the NASA Earth Science mission, which is currently threatened to be scrapped.
By using this app, I found in the 650–950 nanometer range a very strange rise in radiation between 2003 and 2016, which happened mainly in the last 2-3 years. You can see this rise here (click to enlarge):
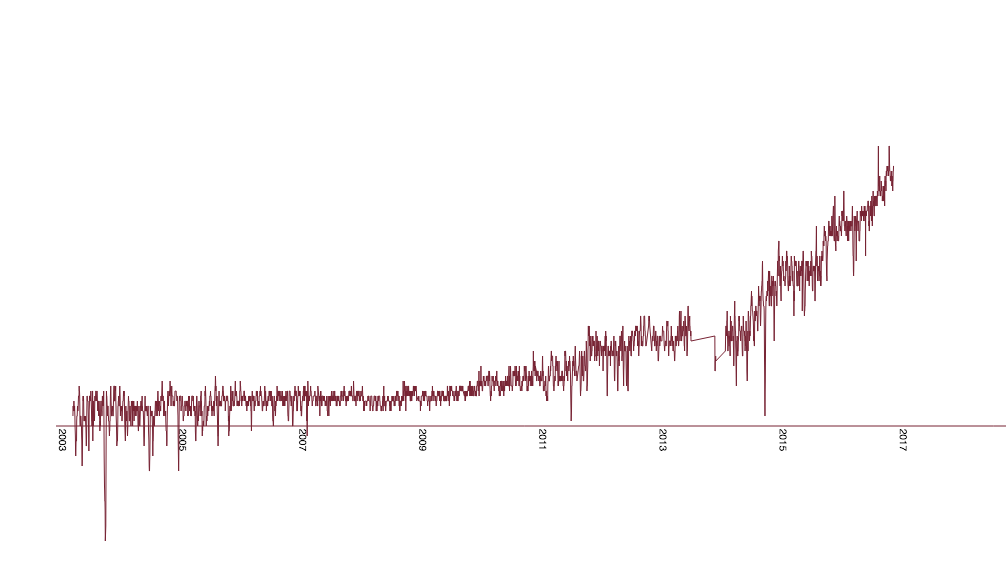
spectral line 774.5nm from day 132 to 5073, day 132 starting Jan 24 in 2003, day 5073 is end of 2016
Now, fluctuations within certain spectral ranges within the Sun’s spectrum are not news. Here, however, it looked as if a rather stable range suddenly started to change rather “dramatically”.
I put the word “dramatically” in quotes for a couple of reasons.
Spectral measurements are complicated and prone to measurement errors. Subtle issues of dirty lenses and the like are already enough to suggest that this is no easy feat, so that this strange rise might easily be due to a measurement failure. Moreover, as I said, it looked as this was a fairly stable range over the course of ten years. But maybe this new rise in irradiation is part of the 11 years solar cycle, i.e., a common phenomenon. In addition, although the rise looks big, it may overall still be rather subtle.
So: how subtle or non-subtle is it then?
In order to assess that, I made a quick estimate (see the Forum discussion) and found that if all the additional radiation would reach the ground (which of course it doesn’t due to absorption), then on 1000 square meters you could easily power a lawn mower with that subtle change! I.e., my estimate was 1200 watts for that patch of lawn. Whoa!
That was disconcerting enough to download the data and linearly interpolate it and calculate the power of that change. I wrote a program in Javascript to do that. The computer calculations revealed an answer of 1000 watts, i.e., my estimate was fairly close. Whoa again!
How does this translate to overall changes in solar irradiance? Some increase had already been noticed. NASA wrote 2003 on its webpage:
Although the inferred increase of solar irradiance in 24 years, about 0.1 percent, is not enough to cause notable climate change, the trend would be important if maintained for a century or more.
That was 13 years ago.
I now used my program to calculate the irradiance for one day in 2016 between the wavelengths of 180.5 nm and 1797.62 nm, a quite big part of the solar spectrum, and got the value 627 W/m2. I computed the difference between this and one day in 2003, approximately one solar cycle earlier. I got 0.61 W/m2, which is 0.1% in 13 years, rather then 24 years. Of course this is not an average value, and not really well adjusted to the sun cycle, and fluctuations play a big role in some parts of the spectrum, but well—this might indicate that the overall rate of rise in solar radiation may have doubled. Likewise concerning the question of the sun’s luminosity: for assessing luminosity one would need to take the concrete satellite-earth orbit at the day of measurement into account, as the distance to the sun varies. But still, on a first glance this all appears disconcerting.
Given that this spectral range has for example an overlap with the absorption of water (clouds!), this should at least be discussed.
See how the spectrum splits into a purple and dark red line in the lower circle? (Click to enlarge.)
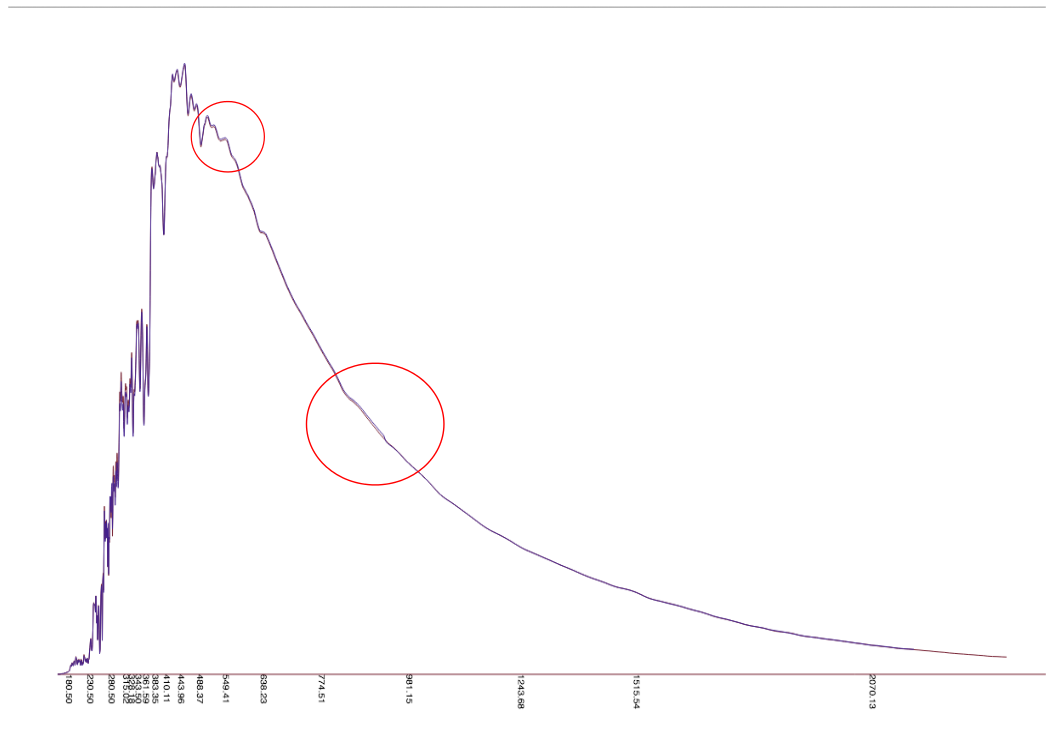
Difference in spectrum between day 132 and 5073
The upper circle displays another rise, which is discussed in the forum.
So concluding, all this looks as if this needs to be monitored a bit more closely. It is important to see whether these rises in irradiance are also displayed in other measurements, so I asked in the Azimuth Forum, but so far have gotten no answer.
The Russian Wikipedia site about solar irradiance unfortunately contains no links to Russian satellite missions (if I haven’t overlooked something), and there exists no Chinese or Indian Wikipedia about solar irradiance. I also couldn’t find any publicly accessible spectral irradiance measurements on the ESA website (although they have some satellites out there). In December I wrote an email to the head of the section solar radiometry of the World Radiation Center (WRC) Wolfgang Finsterle, but I’ve had no answer yet.
In short: if you know about publicly available solar spectral irradiance measurements other than the LISIRD ones, then please let me know.


Hi Nad,
I don’t have anything direct to say about this apart from my general familiarity with publicly documented series which show change and radiative forcing plotted alongside of series of quantities which could be causes, along with analyses that only emissions maje the grade.
But the other thing to note from climate science, or at least post-1960 modern climate science is the Faint Young Sun Paradox (see https://en.m.wikipedia.org/wiki/Faint_young_Sun_paradox) which is a standard problem presented in climate textbooks, e.g., Ray Pierrehumbert’s Principles of Planetary Climate. At least in the early days the Greenhouse appears to have dominated all. Maybe that remains true but I’ll add to my long list dusting off Python code Pierrehumbert has for assesing what changes in radiance in certain bands has upon climate. I might also recommend MODTRAN.
Hello Jan, thanks for reminding of the faint young sun, I had almost forgotten about it. I didn’t know MODTRAN. Thanks for pointing out, but actually I do not plan to recalculate the radiative forcing of methane. I hope this is done by the IPCC group. As you may remember Gunnar Myhre had already said that there are efforts underway to discuss the effect of the near-infrared (which had sofar been omitted). I had asked him again about new works where the inclusion of near-infrared may have changed the radiative forcing, but sofar he was too busy to say something about that. Let’s see what comes out of this.
By the way on the MODTRAN page it is written that
For radiative forcings also so-called broadband models seem to be used.
By the way Jan, speaking of radiative forcings, do you know of satellite measurements, which measure the outgoing spectral irradiance of the earth?
John I detected a typo. I wrote
Frequencies should read either “inverse spatial frequencies” or “wavelength”.
I’ll change it to ‘wavelengths’, since I believe that’s what you mean.
(Sometimes people use frequency to mean 1/wavelength and sometimes they use it to mean /wavelength, so there can be confusion, but I know what wavelengths visible light actually has!)
thanks. yes the wavelengths of visible light is also something which I remember roughly from school, but actually some people use wavenumbers and translating forth and back may be cumbersome and errorprone. So eventually one should put a wavenumber scale underneath the wavelength scale in order to make the comparision easier.
How can you determine that the signal perturbation is from the sun and not from the earth? How well is the sensor shielded to prevent stray radiation from the earth from being detected?
Not that the anomaly coming from the earth wouldn’t be interesting by itself.
@whut wrote:
Hello Paul, I am not a satellite expert and I can only guess that first the measurements are directed towards the sun with the rest of the satellite being between the measurements apparatus and the earth like in this image. Secondly the satellite is at a height of 645km, i.e. higher than the ISS and approximately in the thermopause/exobase, so as Wikipedia says
So there will be some stray radiation but not much. You know that I have the suspicion that the radiation might come from ionized hydrogen.
There is hydrogen in the exosphere, but is it ionized? And as you say where should the additional hydrogen suddenly come from? It seems much more likely that the radiation is from ionized hydrogen in the outer layers of the sun. Moreover the h-alpha line (if it is) seems quite broad.
Possibly higher ionization during periods of high solar activity which are known to emit much higher UV levels, which is an ionizing radiation.
yes this could be a cause. But as said the density up there is rather low. I have no feeling on how much ionized hydrogen you would need for that effect. You also have to take into account that that type of radiation would be undirected in contrast to radiation from the sun. Moreover the increase is over a broad range (roughly 650-950nm), if the source of radiation is in the athmossphere -and emanating from hydrogen (as said this is only a hypothesis!) then I would expect that the H-alpha line would be more pronounced. It is also that the increase seems only noticeable for the bright lines of hydrogen. That might mean that the hydrogen hypothesis is false but it could also mean that the fainter lines are covered by other radiation. Again if the source of radiation would be closer then one could imagine that one should also be able to notice the increase in the other lines.
https://disc.gsfc.nasa.gov/data-holdings/PIP/solar_irradiance.shtml
Check your math: http://education.gsfc.nasa.gov/experimental/all98invproject.site/pages/science-briefs/ed-stickler/ed-irradiance.html
Sorry, but I used the NASA irradiance data you are referring to.
As written above you can find it also in the interactive section. The curves I plotted above are the same as in Nasa’s interactive applet (apart from an overall scaling). Please check it, if you think something is wrong.
I checked the integrals, but of course there could still be mistakes.
So what math exactly do you think is wrong and why?
Earlier this month an article was published in the journal Geology
with interesting data on the subject from a very different point of
view than provided by satellites. They said:
Luthardt and Rossler, Fossil forest reveals sunspot activity in the
early Permian, Geology (2017)
They used dendrochronology on 290 million year old fossil
plants killed during a volcanic eruption. Its amazing how well
plant tissue can be preserved this way. For instance the journal
Science published an article a couple of years ago in which
subcellular structures were visible in plant fossils:
Bomfleur et al., Fossilized Nuclei and Chromosomes Reveal 180
Million Years of Genomic Stasis in Royal Ferns, Science 343, 1376
(2014)
In the recent study the authors found that the length of the
solar cycle was practically the same 290 million years ago as it is
now. Satellite data is great but this ancient data gives me some
confidence that our Sun will not be undergoing rapid stellar
evolution any time soon.
Scott Interesting, yet no one finds that 10-11 year periodicity in living tree rings, nor in coral rings. All they see is a periodicity related to ENSO.
So what they are saying is that 290 million years ago, potentially solar periods had much greater an effect back then than they do now. Yet you can’t rule out that these ancient variations weren’t also caused by an equivalent ENSO of that era, where the oceans had a different geography.
Scott wrote:
Thanks for the links, the Geology article is unfortuantely behind a pay wall.
Well, changes depend on lifetime. As far as I can tell a lot if not most of research in which lifetime is estimated based on observation is done by comparing with other planets. I don’t know how complex the ongoings in the sun are and what variations in lifetime may result from this.
Lisird had just updated their historical TSI (when I wrote the above the applet showed only data until 2014), so actually there it looks as if the TSI goes currently on average down since the 80s:
http://lasp.colorado.edu/lisird/tsi/historical_tsi.html. In particular the irradiation peak in 2014 didn’t extend further up. The historical data is though displayed via a model.
Lisird writes on its about page:
As to be expected there is still a high grade of reconstruction uncertainty, i.e. it is written:
This plot for the January measurements shows though -like my calculation- rather an increasing irradiance, since 2003. But as argued already in the post it is hard to tell because e.g. the peak in 2004 (which looks lower than the one in 2015) might be only a local maximum, i.e it might have been bigger before 2003. For this case the sun cycle would have been longer than 11 ys. This actually may have been the case, since at least the sunspots apparently displayed an unusual behaviour with respect to the sun cycle.
What I find though confusing is that in the historical reconstruction applet the 2004 values are very different from the 2015 values – The 2004 level is according to the applet at 1360.91 W/m^2 i.e below the 1361 level (which is roughly the “middle line” for that cycle) whereas 2015 is at 1361.4291, i.e. at the peak. This is in contrast to the January measurements, where the 2015 peak is roughly also at 1361.5 but where the 2004 peak is only slightly lower, like roughly at 1361.2. I find it very strange that this difference between monthly and annual values should be due to the earth orbit, but I haven’t really found time to think about that thoroughly, i.e. currently I feel not able to say whether there is a bug, but I have the suspicion that there might be a bug and if it seems more likely to be found in the reconstruction applet.
I have the Geology journal paper and this is the entire time series that they are basing their analysis on
It is hard to say what was happening 300 million years
ago. This study gave me some confidence in the Sun’s
stability but it is a new technique and requires confirmation.
An advantage to this method is that the trees died
simultaneously so different specimens could be compared to
each other. This has the drawback that we can not infer
much beyond the trees’ life span with a single sample.
The one doubt which i addressed was whether 300 million
year old fossils could be preserved well enough to extract
climate information from. I find it amazing how well some
fossils have been preserved. I myself have a rock with a
well preserved pollen grain that has a lot of detail
visible under the microscope. The sample in the Geology
article is uncommonly good but it should still be possible
to repeat the study to other periods in the last few hundred
million years. Hopefully we will get the same result for
the solar cycles’ length.
The Science article is also pay walled. Here is a more
freely available subsequent article with the same authors
and the same sample as the Science article to see how well
preserved fossils from hundreds of millions years ago can be:
https://www.researchgate.net/publication/280620245_Osmunda_pulchella_sp_nov_from_the_Jurassic_of_Sweden–reconciling_molecular_and_fossil_evidence_in_the_phylogeny_of_modern_royal_ferns_Osmundaceae
There is an update of this blog post at . The above curve with the subtitle: “spectral line 774.5nm from day 132 to 5073, day 132 starting Jan 24 in 2003, day 5073 is end of 2016” looks now quite differently in the LISIRD interactive app, that is in particular the steep rise towards the end of 2016 has been “corrected” (I write here corrected in quotation marks, since I don’t know how consciously this is seen as a correction) for a broad spectral range and in 2018 this “correction” results in a steep decline in irradiance rather than an expected decline due to the solar cycle. As an example the 798.83nm line (which is in the the 650–950nm range in the second circle in the above image “Difference in spectrum between day 132 and 5073”) looks as of saturday like this:
.
I still don’t know of any other satellite spectral irradiance measurements in this spectral range.
At LISIRD it is now however possible to obtain plots of the dutch OMI mission from 265nm to 500nm, however it stopps in April 2018.
So first here the 500.8 line from end 2016:
and how it looks now:
And here the line from OMI:
Links to images sometimes get killed, but if you tell me the URL’s of the images I think I can include them.
They are all in the blog post at randform:


500.8nm line from SORCE mission as of end 2016:
500.8nm line from SORCE mission as of now:
500 nm line from OMI (until April 2018) as of now:
thanks for editing.